 在 iOS 16 中引入的 SwiftUI 图表,可以以直观的视觉格式呈现数据,并且可以使用 SwiftUI 图表快速创建。本文演示了几种定制折线图并与区域图结合来展示数据的方法。
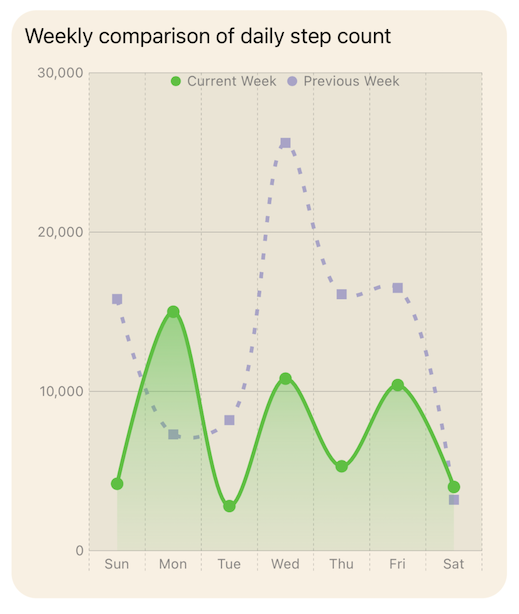
struct ChartView1: View {
var body: some View {
VStack {
GroupBox ( "Line Chart - Daily Step Count") {
Chart {
ForEach(stepData, id: \.period) { steps in
ForEach(steps.data) {
LineMark(
x: .value("Week Day", $0.shortDay),
y: .value("Step Count", $0.steps)
)
.foregroundStyle(by: .value("Week", steps.period))
.accessibilityLabel("\($0.weekdayString)")
.accessibilityValue("\($0.steps) Steps")
}
}
}
.frame(height:400)
}
.padding()
Spacer()
}
}
}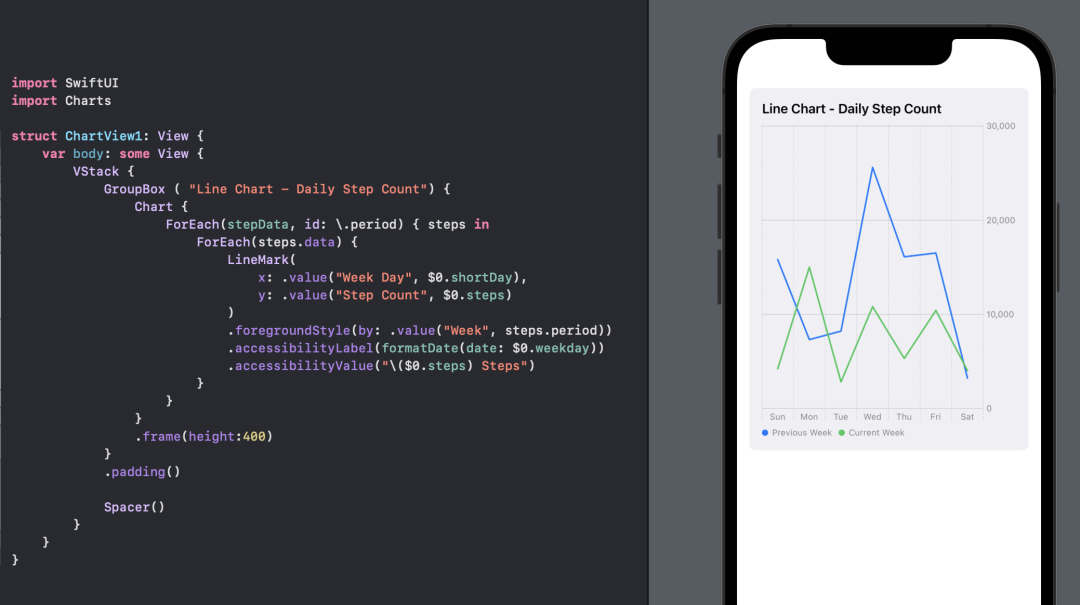 使用 SwiftUI 图表创建的默认折线图。
GroupBox 的背景可以用颜色或 GroupBoxStyle[2] 来设置。struct YellowGroupBoxStyle: GroupBoxStyle {
func makeBody(configuration: Configuration) -> some View {
configuration.content
.padding(.top, 30)
.padding(20)
.background(Color(hue: 0.10, saturation: 0.10, brightness: 0.98))
.cornerRadius(20)
.overlay(
configuration.label.padding(10),
alignment: .topLeading
)
}
}struct ChartView2: View {
var body: some View {
VStack {
GroupBox ( "Line Chart - Daily Step Count") {
Chart {
ForEach(stepData, id: \.period) { steps in
ForEach(steps.data) {
LineMark(
x: .value("Week Day", $0.shortDay),
y: .value("Step Count", $0.steps)
)
.foregroundStyle(by: .value("Week", steps.period))
.accessibilityLabel("\($0.weekdayString)")
.accessibilityValue("\($0.steps) Steps")
}
}
}
.frame(height:400)
}
// Add a style to the GroupBox
.groupBoxStyle(YellowGroupBoxStyle())
.padding()
Spacer()
}
}
}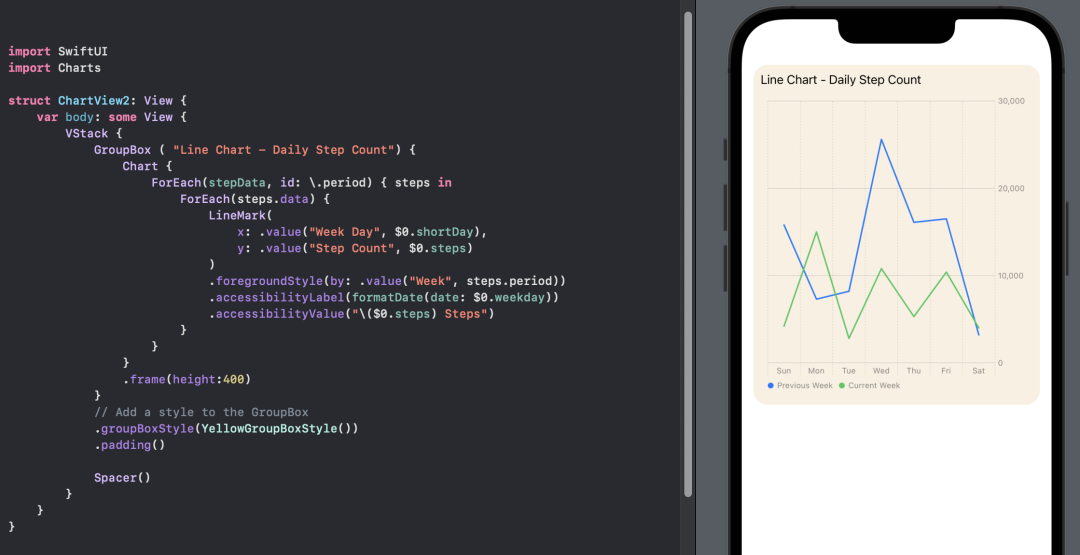 为 GroupBox 背景设置样式。
GroupBox ( "Line Chart - Plot Background") {
    Chart {
        ForEach(stepData, id: \.period) { steps in
            ForEach(steps.data) {
                LineMark(
                    x: .value("Week Day", $0.shortDay),
                    y: .value("Step Count", $0.steps)
                )
                .foregroundStyle(by: .value("Week", steps.period))
                .accessibilityLabel("\($0.weekdayString)")
                .accessibilityValue("\($0.steps) Steps")
            }
        }
    }
    .chartPlotStyle { plotArea in
        plotArea
            .background(.orange.opacity(0.1))
            .border(.orange, width: 2)
    }
    .frame(height:200)
}
.groupBoxStyle(YellowGroupBoxStyle())GroupBox ( "Line Chart - Chart Background") {
Chart {
ForEach(stepData, id: \.period) { steps in
ForEach(steps.data) {
LineMark(
x: .value("Week Day", $0.shortDay),
y: .value("Step Count", $0.steps)
)
.foregroundStyle(by: .value("Week", steps.period))
.accessibilityLabel("\($0.weekdayString)")
.accessibilityValue("\($0.steps) Steps")
}
}
}
.chartBackground { chartProxy in
Color.red.opacity(0.1)
}
.frame(height:200)
}
.groupBoxStyle(YellowGroupBoxStyle()) GroupBox ( "Line Chart - Plot & Chart Backgroundt") {
Chart {
ForEach(stepData, id: \.period) { steps in
ForEach(steps.data) {
LineMark(
x: .value("Week Day", $0.shortDay),
y: .value("Step Count", $0.steps)
)
.foregroundStyle(by: .value("Week", steps.period))
.accessibilityLabel("\($0.weekdayString)")
.accessibilityValue("\($0.steps) Steps")
}
}
}
.chartBackground { chartProxy in
Color.red.opacity(0.1)
}
.chartPlotStyle { plotArea in
plotArea
.background(.orange.opacity(0.1))
.border(.orange, width: 2)
}
.frame(height:200)
}
.groupBoxStyle(YellowGroupBoxStyle())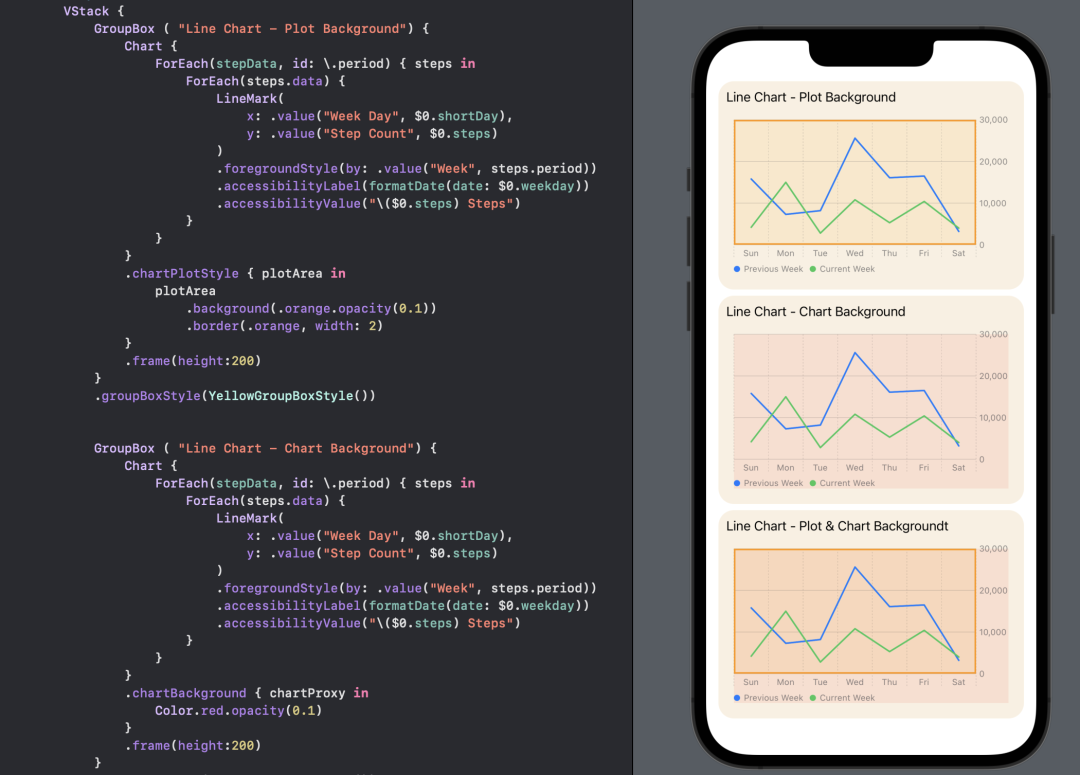 使用 SwiftUI Charts 在绘图区域和全图表上设置背景。
struct ChartView4: View {
var body: some View {
VStack {
GroupBox ( "Line Chart - Y-axis on leading edge") {
Chart {
ForEach(stepData, id: \.period) { steps in
ForEach(steps.data) {
LineMark(
x: .value("Week Day", $0.shortDay),
y: .value("Step Count", $0.steps)
)
.foregroundStyle(by: .value("Week", steps.period))
.accessibilityLabel("\($0.weekdayString)")
.accessibilityValue("\($0.steps) Steps")
}
}
}
.chartPlotStyle { plotArea in
plotArea
.background(Color(hue: 0.12, saturation: 0.10, brightness: 0.92))
}
// Place the y-axis on the leading side of the chart
.chartYAxis {
AxisMarks(position: .leading)
}
.frame(height:400)
}
.groupBoxStyle(YellowGroupBoxStyle())
.padding()
Spacer()
}
}
}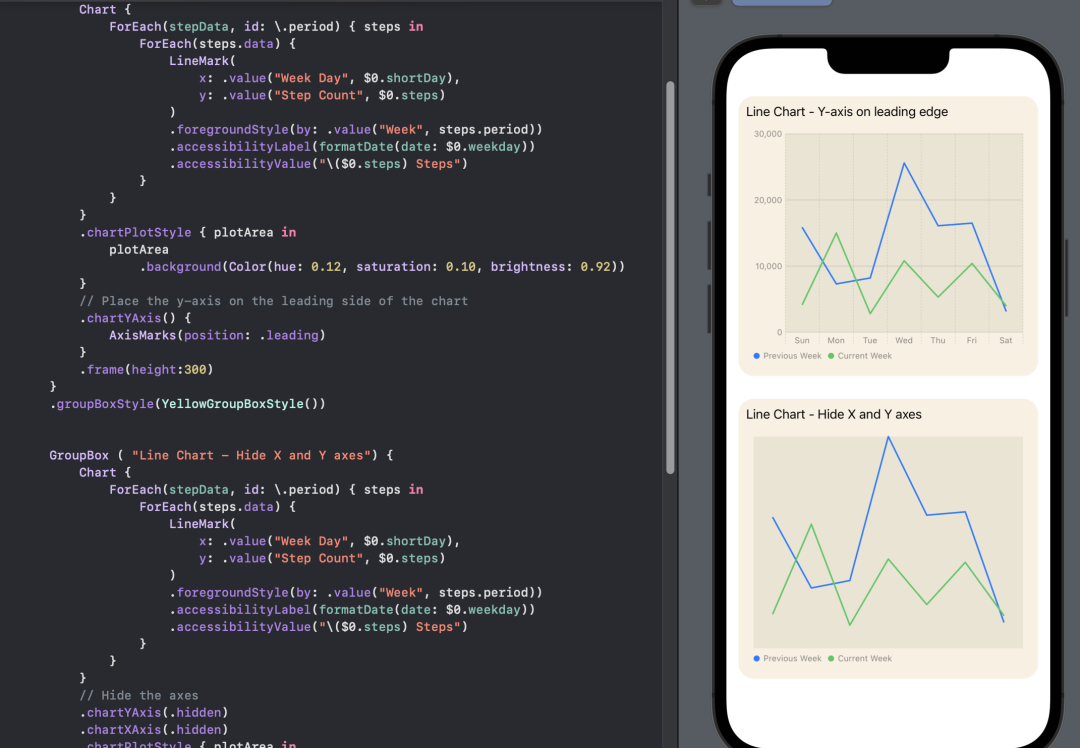 使用 SwiftUI 图表将 Y 轴置于图表的左侧。
GroupBox ( "Line Chart - legend overlay on top center") {
    Chart {
        ForEach(stepData, id: \.period) { steps in
            ForEach(steps.data) {
                LineMark(
                    x: .value("Week Day", $0.shortDay),
                    y: .value("Step Count", $0.steps)
                )
                .foregroundStyle(by: .value("Week", steps.period))
                .accessibilityLabel("\($0.weekdayString)")
                .accessibilityValue("\($0.steps) Steps")
            }
        }
    }
    // Position the Legend
    .chartLegend(position: .overlay, alignment: .top)
    .chartPlotStyle { plotArea in
        plotArea
            .background(Color(hue: 0.12, saturation: 0.10, brightness: 0.92))
    }
    .chartYAxis() {
        AxisMarks(position: .leading)
    }
    .frame(height:200)
}
.groupBoxStyle(YellowGroupBoxStyle())
GroupBox ( "Line Chart - legend trailing center") {
Chart {
ForEach(stepData, id: \.period) { steps in
ForEach(steps.data) {
LineMark(
x: .value("Week Day", $0.shortDay),
y: .value("Step Count", $0.steps)
)
.foregroundStyle(by: .value("Week", steps.period))
.accessibilityLabel("\($0.weekdayString)")
.accessibilityValue("\($0.steps) Steps")
}
}
}
// Position the Legend
.chartLegend(position: .trailing, alignment: .center, spacing: 10)
.chartPlotStyle { plotArea in
plotArea
.background(Color(hue: 0.12, saturation: 0.10, brightness: 0.92))
}
.chartYAxis() {
AxisMarks(position: .leading)
}
.frame(height:200)
}
.groupBoxStyle(YellowGroupBoxStyle())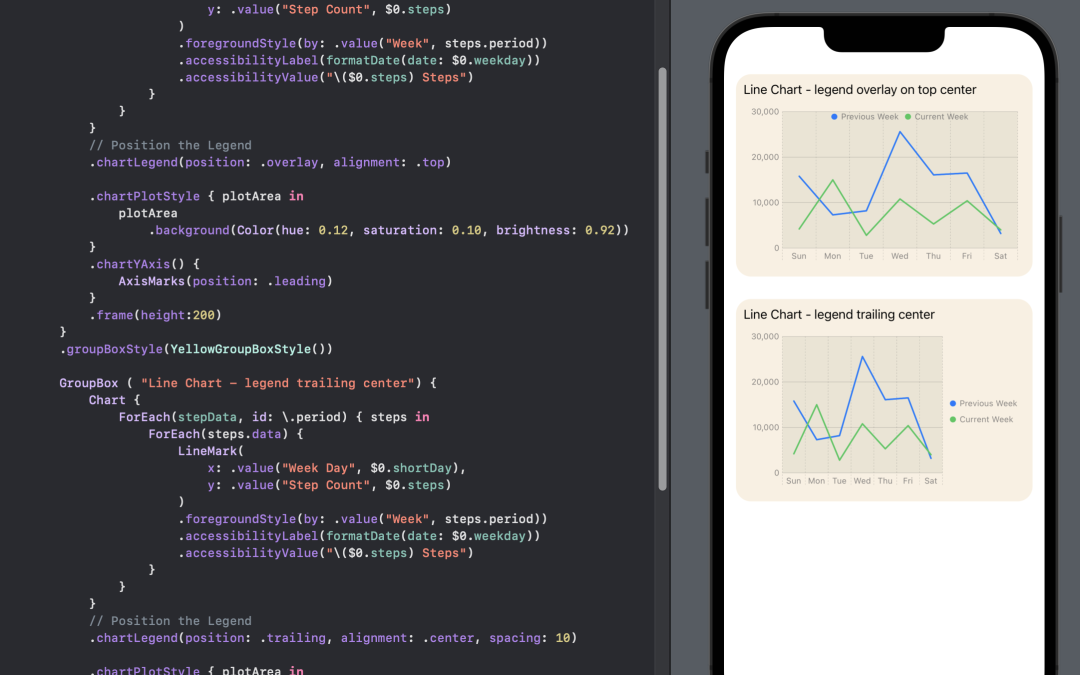
struct ChartView6: View {
var body: some View {
VStack(spacing:30) {
GroupBox ( "Line Chart - Curved line connector") {
Chart {
ForEach(stepData, id: \.period) { steps in
ForEach(steps.data) {
LineMark(
x: .value("Week Day", $0.shortDay),
y: .value("Step Count", $0.steps)
)
.foregroundStyle(by: .value("Week", steps.period))
// Use curved line to join points
.interpolationMethod(.catmullRom)
.accessibilityLabel("\($0.weekdayString)")
.accessibilityValue("\($0.steps) Steps")
}
}
}
.chartLegend(position: .overlay, alignment: .top)
.chartPlotStyle { plotArea in
plotArea
.background(Color(hue: 0.12, saturation: 0.10, brightness: 0.92))
}
.chartYAxis() {
AxisMarks(position: .leading)
}
.frame(height:300)
}
.groupBoxStyle(YellowGroupBoxStyle())
GroupBox ( "Line Chart - Step line connector") {
Chart {
ForEach(stepData, id: \.period) { steps in
ForEach(steps.data) {
LineMark(
x: .value("Week Day", $0.shortDay),
y: .value("Step Count", $0.steps)
)
.foregroundStyle(by: .value("Week", steps.period))
// Use step line to join points
.interpolationMethod(.stepCenter)
.accessibilityLabel("\($0.weekdayString)")
.accessibilityValue("\($0.steps) Steps")
}
}
}
.chartLegend(position: .overlay, alignment: .top)
.chartPlotStyle { plotArea in
plotArea
.background(Color(hue: 0.12, saturation: 0.10, brightness: 0.92))
}
.chartYAxis() {
AxisMarks(position: .leading)
}
.frame(height:300)
}
.groupBoxStyle(YellowGroupBoxStyle())
Spacer()
}
.padding()
}
}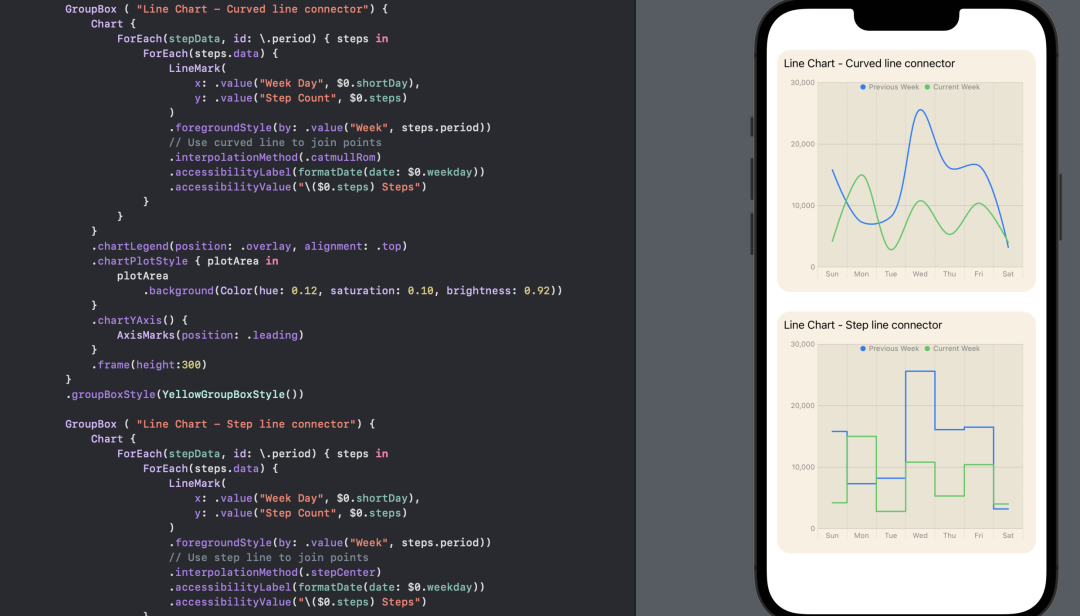 在 SwiftUI 图表中更改将数据点连接线型。
struct ChartView7: View {
var body: some View {
VStack() {
GroupBox ( "Line Chart - Custom line colors") {
Chart {
ForEach(stepData, id: \.period) { steps in
ForEach(steps.data) {
LineMark(
x: .value("Week Day", $0.shortDay),
y: .value("Step Count", $0.steps)
)
.foregroundStyle(by: .value("Week", steps.period))
.interpolationMethod(.catmullRom)
.symbol(by: .value("Week", steps.period))
.symbolSize(30)
.accessibilityLabel("\($0.weekdayString)")
.accessibilityValue("\($0.steps) Steps")
}
}
}
// Set color for each data in the chart
.chartForegroundStyleScale([
"Current Week" : Color(hue: 0.33, saturation: 0.81, brightness: 0.76),
"Previous Week": Color(hue: 0.69, saturation: 0.19, brightness: 0.79)
])
.chartLegend(position: .overlay, alignment: .top)
.chartPlotStyle { plotArea in
plotArea
.background(Color(hue: 0.12, saturation: 0.10, brightness: 0.92))
}
.chartYAxis() {
AxisMarks(position: .leading)
}
.frame(height:400)
}
.groupBoxStyle(YellowGroupBoxStyle())
Spacer()
}
.padding()
}
}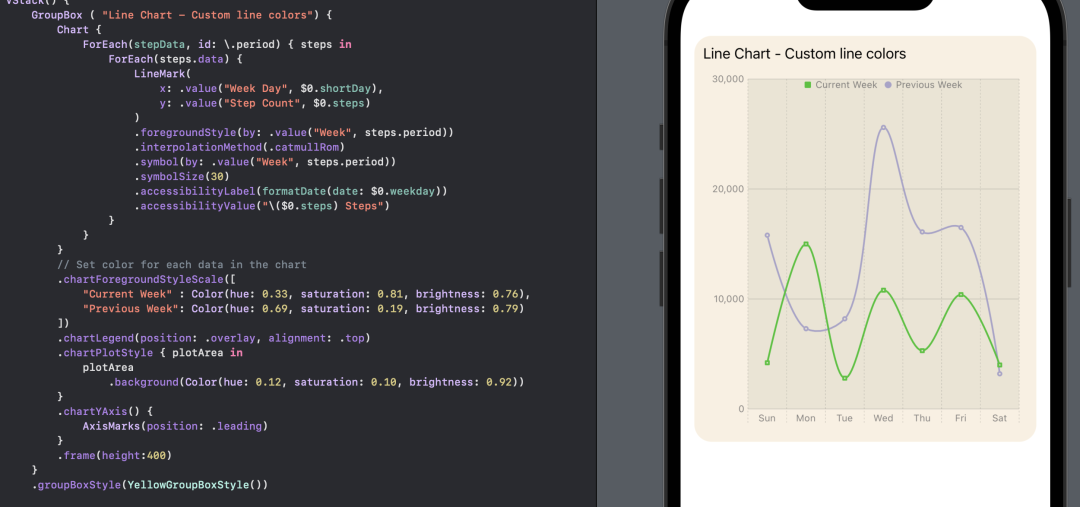 为 SwiftUI 图表中的线条设置自定义颜色。
lineStyle 来修改。在步骤数据中使用了两种不同的风格,以区分前一周的数据和当前的数据。此外,还为图表上的数据点设置了一个自定义符号。struct ChartView8: View {
let prevColor = Color(hue: 0.69, saturation: 0.19, brightness: 0.79)
let curColor = Color(hue: 0.33, saturation: 0.81, brightness: 0.76)
var body: some View {
VStack() {
GroupBox ( "Line Chart - Line color and format") {
Chart {
ForEach(previousWeek) {
LineMark(
x: .value("Week Day", $0.shortDay),
y: .value("Step Count", $0.steps)
)
.interpolationMethod(.catmullRom)
.foregroundStyle(prevColor)
.foregroundStyle(by: .value("Week", "Previous Week"))
.lineStyle(StrokeStyle(lineWidth: 3, dash: [5, 10]))
.symbol() {
Rectangle()
.fill(prevColor)
.frame(width: 8, height: 8)
}
.symbolSize(30)
.accessibilityLabel("\($0.weekdayString)")
.accessibilityValue("\($0.steps) Steps")
}
ForEach(currentWeek) {
LineMark(
x: .value("Week Day", $0.shortDay),
y: .value("Step Count", $0.steps)
)
.interpolationMethod(.catmullRom)
.foregroundStyle(curColor)
.foregroundStyle(by: .value("Week", "Current Week"))
.lineStyle(StrokeStyle(lineWidth: 3))
.symbol() {
Circle()
.fill(curColor)
.frame(width: 10)
}
.symbolSize(30)
.accessibilityLabel("\($0.weekdayString)")
.accessibilityValue("\($0.steps) Steps")
}
}
// Set the Y axis scale
.chartYScale(domain: 0...30000)
.chartForegroundStyleScale([
"Current Week" : curColor,
"Previous Week": prevColor
])
.chartLegend(position: .overlay, alignment: .top)
.chartPlotStyle { plotArea in
plotArea
.background(Color(hue: 0.12, saturation: 0.10, brightness: 0.92))
}
.chartYAxis() {
AxisMarks(position: .leading)
}
.frame(height:400)
}
.groupBoxStyle(YellowGroupBoxStyle())
Spacer()
}
.padding()
}
}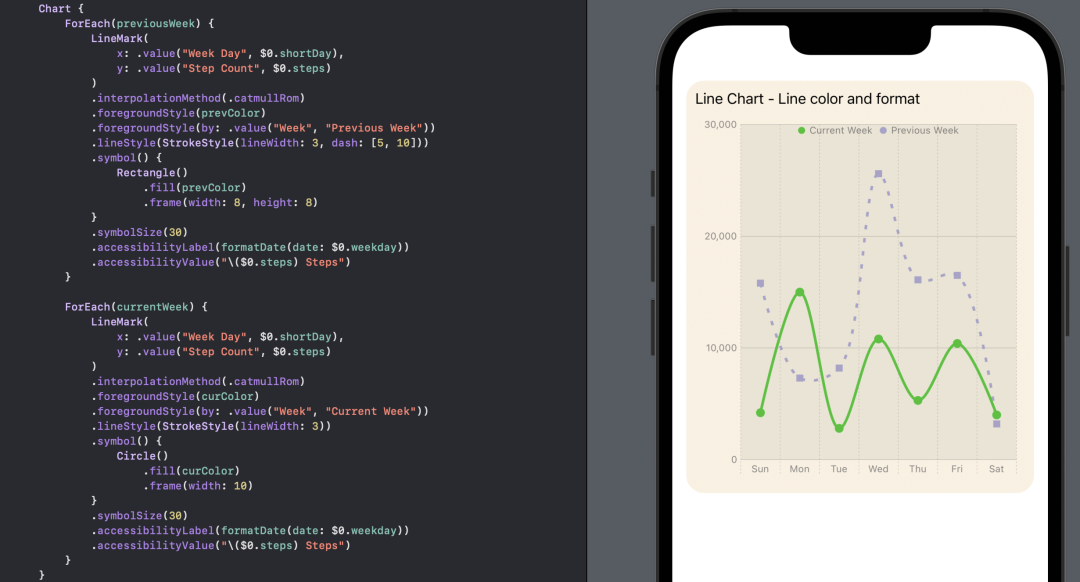 为 SwiftUI 图表中的一个数据集设置自定义线型。
struct ChartView9: View {
var body: some View {
let prevColor = Color(hue: 0.69, saturation: 0.19, brightness: 0.79)
let curColor = Color(hue: 0.33, saturation: 0.81, brightness: 0.76)
let curGradient = LinearGradient(
gradient: Gradient (
colors: [
curColor.opacity(0.5),
curColor.opacity(0.2),
curColor.opacity(0.05),
]
),
startPoint: .top,
endPoint: .bottom
)
VStack() {
GroupBox ( "Line Chart - Combine LIne and Area chart") {
Chart {
ForEach(previousWeek) {
LineMark(
x: .value("Week Day", $0.shortDay),
y: .value("Step Count", $0.steps)
)
.interpolationMethod(.catmullRom)
.foregroundStyle(prevColor)
.foregroundStyle(by: .value("Week", "Previous Week"))
.lineStyle(StrokeStyle(lineWidth: 3, dash: [5, 10]))
.symbol() {
Rectangle()
.fill(prevColor)
.frame(width: 8, height: 8)
}
.symbolSize(30)
.accessibilityLabel("\($0.weekdayString)")
.accessibilityValue("\($0.steps) Steps")
}
ForEach(currentWeek) {
LineMark(
x: .value("Week Day", $0.shortDay),
y: .value("Step Count", $0.steps)
)
.interpolationMethod(.catmullRom)
.foregroundStyle(curColor)
.foregroundStyle(by: .value("Week", "Current Week"))
.lineStyle(StrokeStyle(lineWidth: 3))
.symbol() {
Circle()
.fill(curColor)
.frame(width: 10)
}
.symbolSize(30)
.accessibilityLabel("\($0.weekdayString)")
.accessibilityValue("\($0.steps) Steps")
AreaMark(
x: .value("Week Day", $0.shortDay),
y: .value("Step Count", $0.steps)
)
.interpolationMethod(.catmullRom)
.foregroundStyle(curGradient)
.foregroundStyle(by: .value("Week", "Current Week"))
.accessibilityLabel("\($0.weekdayString)")
.accessibilityValue("\($0.steps) Steps")
}
}
// Set the Y axis scale
.chartYScale(domain: 0...30000)
.chartForegroundStyleScale([
"Current Week" : curColor,
"Previous Week": prevColor
])
.chartLegend(position: .overlay, alignment: .top)
.chartPlotStyle { plotArea in
plotArea
.background(Color(hue: 0.12, saturation: 0.10, brightness: 0.92))
}
.chartYAxis() {
AxisMarks(position: .leading)
}
.frame(height:400)
}
.groupBoxStyle(YellowGroupBoxStyle())
Spacer()
}
.padding()
}
}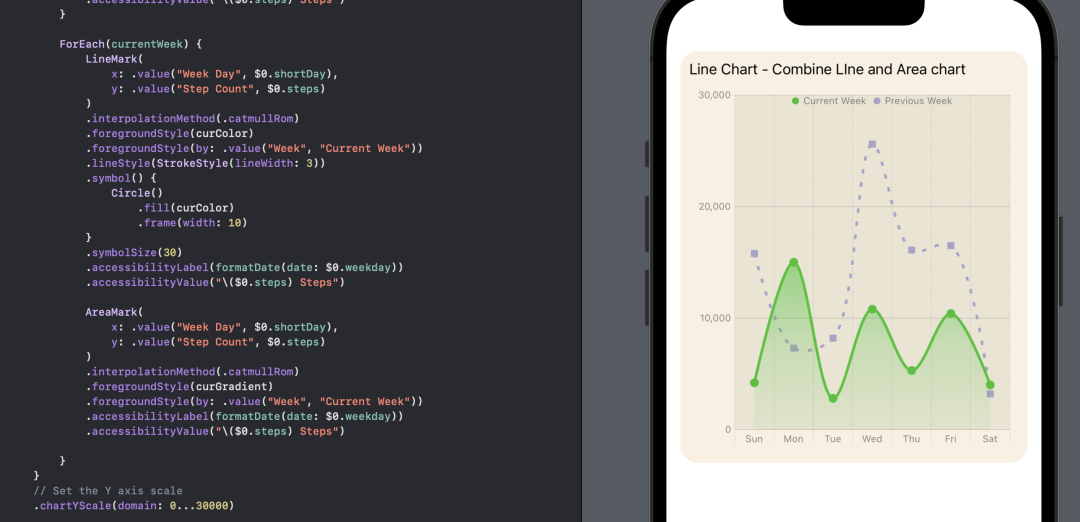 在SwiftUI图表中使用自定义颜色将折线图与面积图结合起来。
使用带有Rails插件的vim,您可以创建一个迁移文件,然后一次性打开该文件吗?textmate也可以这样吗? 最佳答案 你可以使用rails.vim然后做类似的事情::Rgeneratemigratonadd_foo_to_bar插件将打开迁移生成的文件,这正是您想要的。我不能代表textmate。 关于ruby-使用VimRails,您可以创建一个新的迁移文件并一次性打开它吗?,我们在StackOverflow上找到一个类似的问题: https://sta
我需要从一个View访问多个模型。以前,我的links_controller仅用于提供以不同方式排序的链接资源。现在我想包括一个部分(我假设)显示按分数排序的顶级用户(@users=User.all.sort_by(&:score))我知道我可以将此代码插入每个链接操作并从View访问它,但这似乎不是“ruby方式”,我将需要在不久的将来访问更多模型。这可能会变得很脏,是否有针对这种情况的任何技术?注意事项:我认为我的应用程序正朝着单一格式和动态页面内容的方向发展,本质上是一个典型的网络应用程序。我知道before_filter但考虑到我希望应用程序进入的方向,这似乎很麻烦。最终从任何
我想要做的是有2个不同的Controller,client和test_client。客户端Controller已经构建,我想创建一个test_clientController,我可以使用它来玩弄客户端的UI并根据需要进行调整。我主要是想绕过我在客户端中内置的验证及其对加载数据的管理Controller的依赖。所以我希望test_clientController加载示例数据集,然后呈现客户端Controller的索引View,以便我可以调整客户端UI。就是这样。我在test_clients索引方法中试过这个:classTestClientdefindexrender:template=>
如果您尝试在Ruby中的nil对象上调用方法,则会出现NoMethodError异常并显示消息:"undefinedmethod‘...’fornil:NilClass"然而,有一个tryRails中的方法,如果它被发送到一个nil对象,它只返回nil:require'rubygems'require'active_support/all'nil.try(:nonexisting_method)#noNoMethodErrorexceptionanymore那么try如何在内部工作以防止该异常? 最佳答案 像Ruby中的所有其他对象
关闭。这个问题需要detailsorclarity.它目前不接受答案。想改进这个问题吗?通过editingthispost添加细节并澄清问题.关闭8年前。Improvethisquestion为什么SecureRandom.uuid创建一个唯一的字符串?SecureRandom.uuid#=>"35cb4e30-54e1-49f9-b5ce-4134799eb2c0"SecureRandom.uuid方法创建的字符串从不重复?
这是一道面试题,我没有答对,但还是很好奇怎么解。你有N个人的大家庭,分别是1,2,3,...,N岁。你想给你的大家庭拍张照片。所有的家庭成员都排成一排。“我是家里的friend,建议家庭成员安排如下:”1岁的家庭成员坐在这一排的最左边。每两个坐在一起的家庭成员的年龄相差不得超过2岁。输入:整数N,1≤N≤55。输出:摄影师可以拍摄的照片数量。示例->输入:4,输出:4符合条件的数组:[1,2,3,4][1,2,4,3][1,3,2,4][1,3,4,2]另一个例子:输入:5输出:6符合条件的数组:[1,2,3,4,5][1,2,3,5,4][1,2,4,3,5][1,2,4,5,3][
我正在尝试在Ruby中制作一个cli应用程序,它接受一个给定的数组,然后将其显示为一个列表,我可以使用箭头键浏览它。我觉得我已经在Ruby中看到一个库已经这样做了,但我记不起它的名字了。我正在尝试对soundcloud2000中的代码进行逆向工程做类似的事情,但他的代码与SoundcloudAPI的使用紧密耦合。我知道cursesgem,我正在考虑更抽象的东西。广告有没有人见过可以做到这一点的库或一些概念证明的Ruby代码可以做到这一点? 最佳答案 我不知道这是否是您正在寻找的,但也许您可以使用我的想法。由于我没有关于您要完成的工作
我有一个正在构建的应用程序,我需要一个模型来创建另一个模型的实例。我希望每辆车都有4个轮胎。汽车模型classCar轮胎模型classTire但是,在make_tires内部有一个错误,如果我为Tire尝试它,则没有用于创建或新建的activerecord方法。当我检查轮胎时,它没有这些方法。我该如何补救?错误是这样的:未定义的方法'create'forActiveRecord::AttributeMethods::Serialization::Tire::Module我测试了两个环境:测试和开发,它们都因相同的错误而失败。 最佳答案
这里有一个很好的答案解释了如何在Ruby中下载文件而不将其加载到内存中:https://stackoverflow.com/a/29743394/4852737require'open-uri'download=open('http://example.com/image.png')IO.copy_stream(download,'~/image.png')我如何验证下载文件的IO.copy_stream调用是否真的成功——这意味着下载的文件与我打算下载的文件完全相同,而不是下载一半的损坏文件?documentation说IO.copy_stream返回它复制的字节数,但是当我还没有下
我正在尝试解析一个文本文件,该文件每行包含可变数量的单词和数字,如下所示:foo4.500bar3.001.33foobar如何读取由空格而不是换行符分隔的文件?有什么方法可以设置File("file.txt").foreach方法以使用空格而不是换行符作为分隔符? 最佳答案 接受的答案将slurp文件,这可能是大文本文件的问题。更好的解决方案是IO.foreach.它是惯用的,将按字符流式传输文件:File.foreach(filename,""){|string|putsstring}包含“thisisanexample”结果的