现代社会的无人机成本造价低、不易损耗、轻巧灵便、易躲藏、能精确打击
目标这些特点,使其在一些高危任务中发挥了不可替代的作用[5]。无人机的用处主要有两种:民用和军事。在民用方面,我们可以运用无人机对一些可能出现隐患的事物进行监控,比如对震后灾区的地面勘探、森林火灾的检测、风暴中心的气象数据等。在 2014 索契奥运会上,无人机携带的摄像拍摄的画面更贴近运动员,画质更为清晰,2018 中国新年春晚上大量无人机组成的海豚造型惊艳了世界。在军事方面,我们可以运用无人机进行一些特殊任务的执行,比如对毒贩的监视工作,边境的巡防工作,无人机侦查、搜救、预警等。无人机的运用使我们在一些事情上实现了无人员伤亡。军事无人机是当今时代无人机技术的高水准体现。伴随着日益成熟的无人机技术,对航路规划的研究也愈加深入。航路规划的前提是在一定的约束条件下,然后寻求可飞行航路。对于无人机而言它自身的主要约束条件有:最大的载重量、可以上升的门限高度、空载时耗油量、起飞时承载的重量等,在飞行时要考虑地形存在的威胁和是否存在禁飞区等。相对国外研究,我国还没有比较成熟的航路规划体系,但是对航路规划的研究热情我国日益加强.飞行过程中有时会遇到一些突发事故,无人机在此时不能按照预先规划的航迹继续进行,需要无人机能够在当前的环境下动态的规划出一条满足要求的航路,也说明了航路规划的静态和实时动态规划相结合的算法是我们未来的一个研究趋势。
随着现代社会的不断发展,电子信息技术研究不断深入,无人机航路规划越
来越智能化。现代社会由于飞机的特殊性,其安全性一直是我们最为关心的话题,因为一旦发生一点点事故,往往伴随着生命的代价,所以在面对一些内部环境比较复杂的地方时,可以使用一些有着特殊功能的无人机,它们在无人的状态下可以将性能调整到最优,在执行任务的过程中不用担心其产生人员伤亡,而且无人机的活动区域比较广泛,不限单次使用,能够执行多种任务。现代战场上无人机的威力发挥很大程度上取决于航路规划的合理性。根据模型,航路规划通常会产生很多条满足条件的航路,而我们要做的就是快速、准确找到这些满足要求航路中的最优一条。随着无人机的硬件和软件技术的不断成熟,无人机航路规划技术也必将得到更好的发展和更广泛的应用.
%%%%%%%%%%%%%%%%%%%%%%%%%%%%%%%%%%%%%%%%%%%%%%%%%%%%%%%%%%%%%%%%%%%%%%%%%%%
% E150 Genetic Algorithm Evolution Visualizer
 % Avery Rock, UC Berkeley Mechanical Engineering, avery_rock@berkeley.edu
 % Written for E150, Fall 2019.
%%%%%%%%%%%%%%%%%%%%%%%%%%%%%%%%%%%%%%%%%%%%%%%%%%%%%%%%%%%%%%%%%%%%%%%%%%%
function familyTree(Orig, parents, pop)
 %%
% Inputs:
 %   Orig -- the indices of a sorted GA generation from before sorting (see sort() documentation),
 %   parents -- the number of parents, required for interpreting source
 %   pop --  the number of performers to plot. Use pop >= parents.
% Returns:
 % no variables, plots a representation of the evolution history to the current figure.
% The function automatically ignores generations where no rank changes
 % occur among the parents OR there are any repeated indices (indicating
 % incorrect data).
% Data visualization: This function can be used to visualize and interpret the performance of
 % your GA iteration process. Gray lines represent "survival" with or
 % without a rank change. Red lines represent breeding (e.g.,  a new string
 % will be connected to its parents with red lines). New random strings have
 % no connections. A surviving string will be represented with gray, a new
 % string generated randomly will be a blue mark and a new string generated
 % by breeding will be red.
% Performance interpretation: If your GA is working correctly, there should
 % be lots of turnover (i.e., few generations where nothing happens),
 % significant numbers of successful offspring and a moderate number of
 % successful random strings. You can also spot stagnation (a parent
 % surviving for many generations and continually producing offspring that
 % stay in the top ranks).
%%
Orig2 = Orig(:, 1:pop); % trim source to just relevant entries.
 row = 0; changes = []; % initialize variables for determining relevant generations
 children = parents; % assume nearest-neighbor with two children
 rando = zeros(0, 2); inc = zeros(0, 2); kid = zeros(0, 2); % intialize empty storage arrays
 G = size(Orig, 1); % total number of generations.
 pts = 25; % number of points to plot in connections
 c1 = [.6 .6 .6]; c2 = [1 .6 .6]; % line colors for surviving connections and children
 lw = 1.5; % connection line weight
 mw = 1.5; % marker line weight
incx = zeros(pts, 2); incy = zeros(pts, 2); % empty arrays for connecting line coordinates.
 kidx = zeros(pts, 2); kidy = zeros(pts, 2);
for g = 1:G % for every generation
     if ~isequal(Orig2(g, 1:parents), 1:parents) && length(unique(Orig2(g, :))) == pop % if a change in survivors and valid data
         row = row + 1; % row on which to plot current state - counts relevant generations
         x1 = row - 1; x2 = row; % start and end points of connections
         changes = [changes; g]; % record that a change occured in this generation
         for i = 1:pop
             s = Orig2(g, i); y2 = i;
             if s == i && i <= parents && g > 1 % if the entry is a surviving parent who has not moved
                 y1 = i;
                 [xx, yy] = mySpline([x1 x2], [y1 y2], pts);
                 incx = [incx, xx]; incy = [incy, yy];
                 inc = [inc; [x2, y2]];
             elseif  s <= parents && g > 1% if the entry is a surviving parent who has been moved down
                 y1 = s;
                 [xx, yy] = mySpline([x1 x2], [y1 y2], pts);
                 incx = [incx, xx]; incy = [incy, yy];
                 inc = [inc; [x2, y2]];
             elseif s <= parents + children && g > 1 % if the entry is a child
                 for n = 2:2:children
                     if s <= parents + n
                         y11 = n - 1; y12 = n;
                         [xx1, yy1] = mySpline([x1, x2], [y11, y2], pts);
                         [xx2, yy2] = mySpline([x1, x2], [y12, y2], pts);
                         kidx = [kidx, xx1, xx2]; kidy = [kidy, yy1, yy2];
                         kid = [kid; [x2, y2]];
                         break
                     end
                 end
             else % if it's a new random addition.
                 rando = [rando; [x2, y2]];
             end
         end
     end
 end
p1 = plot(incx, incy, '-', 'Color', c1, 'LineWidth', 1.5); hold on
 p2 = plot(kidx, kidy, '-', 'Color', c2, 'LineWidth', 1.5); hold on
 p3 = plot(rando(:, 1), rando(:, 2), 's', 'MarkerEdgeColor', [.2 .4 .9], 'MarkerFaceColor', [.6 .6 1], 'MarkerSize', 10, 'LineWidth', mw); hold on % plot random
 p4 = plot(inc(:, 1), inc(:, 2), 's', 'MarkerEdgeColor', [.3 .3 .3], 'MarkerFaceColor', [.6 .6 .6], 'MarkerSize', 10, 'LineWidth', mw); hold on % plot survival
 p5 = plot(kid(:, 1), kid(:, 2), 's', 'MarkerEdgeColor', [.9 .3 .3], 'MarkerFaceColor', [1 .6 .6], 'MarkerSize', 10, 'LineWidth', mw); % plot children
 h = [p3, p4, p5];
 legend(h, "Random", "Incumbent", "Child")
xlabels = {};
 for i = 1:numel(changes)
     xlabels{i} = num2str(changes(i));
 end
ylabels = {};
 for j = 1:pop
     ylabels{j} = num2str(j);
 end
title("Family Tree");
 set(gca, 'xtick', [1:row]); set(gca,'ytick', [1:pop]);
 set(gca,'xticklabel', xlabels); set(gca,'yticklabel', ylabels);
 xlabel("generation"); ylabel("Rank");
 axis([0 row + 1 0 pop + 1]); view([90, 90])
 end
function [xx, yy] = mySpline(x, y, pts)
 % produces clamped splines between two points
% Inputs:
 %   x -- 2-value vector containing the x coordinates of the end points
 %   y -- 2-value vector containing the y coordinates of the end points
 %   pts -- the number of total points to plot (ends plus intermediates)
% Returns:
 %    xx -- array of x coordinates to plot
 %    yy -- array of y coordinates to plot
cs = spline(x, [0 y 0]);
 xx = linspace(x(1), x(2), pts)';
 yy = ppval(cs,xx);
 end
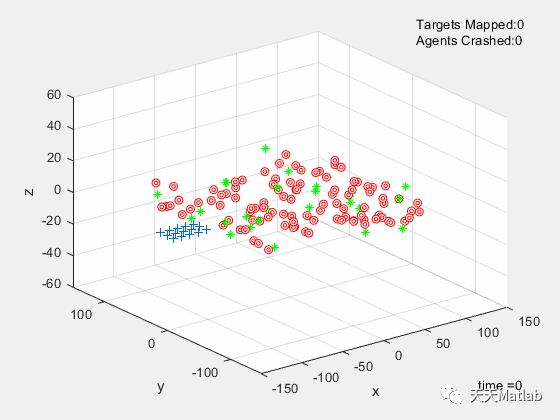
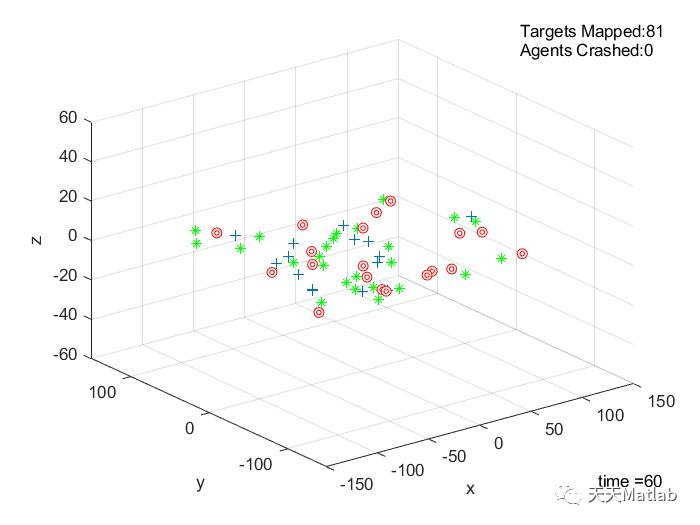
UAV swarms have numerous applications in our modern world. They can facilitate mapping, observing, and overseeing large areas with ease. It is necessary for these agents to autonomously navigate potentially dangerous terrain and airspace in order to log information about areas. In this project, we simulate the motion of a swarm of drones, and their interaction with obstacles, and targets.
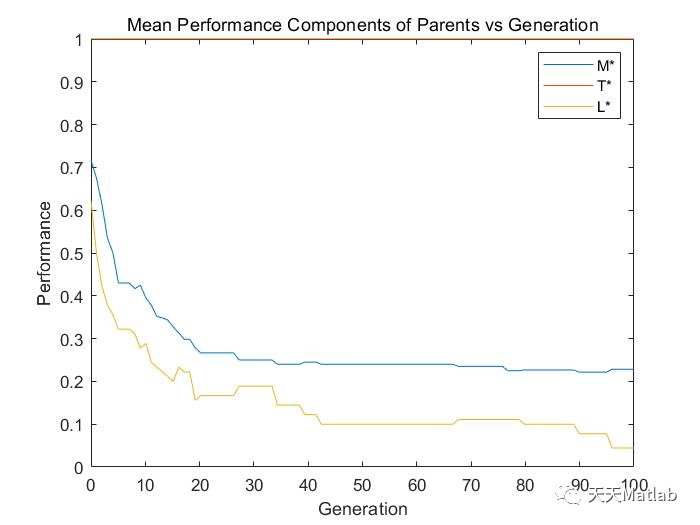
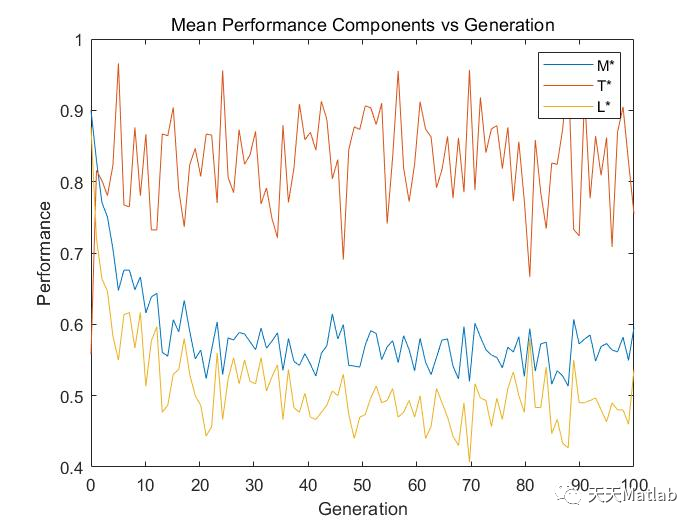
The goal of this project is to optimize this simulation using a Genetic Algorithm to maximize the number of targets mapped, minimize the number of crashed drones, and minimize the amount of time used in the simulation. To do this, we will use 15 design parameters to determine the dynamics and kinematics of each drone, using Forward Euler time discretization to update drone positions.
A Genetic Algorithm will be used to train this swarm of drones by generating random strings of design parameters, and breeding new strings to find the optimal string for this simulation.
In this paper, I will present relevant background information, and equations to describe the simulation. I will also describe the process by which I go about optimizing the Genetic Algorithm. Finally, I present the outcome of the simulation and Genetic Algorithm, and discuss the relevance of my results.

[1]杨军, 王道波, 渠尊尊,等. 基于元胞遗传算法的多无人机编队集结路径规划[J]. 机械与电子, 2018, 36(1):5.
[2]黄书召, 田军委, 乔路,等. 基于改进遗传算法的无人机路径规划[J]. 2021.
[3]邵壮. 多无人机编队路径规划与队形控制技术研究[D]. 西北工业大学.
部分理论引用网络文献,若有侵权联系博主删除。
如何在buildr项目中使用Ruby?我在很多不同的项目中使用过Ruby、JRuby、Java和Clojure。我目前正在使用我的标准Ruby开发一个模拟应用程序,我想尝试使用Clojure后端(我确实喜欢功能代码)以及JRubygui和测试套件。我还可以看到在未来的不同项目中使用Scala作为后端。我想我要为我的项目尝试一下buildr(http://buildr.apache.org/),但我注意到buildr似乎没有设置为在项目中使用JRuby代码本身!这看起来有点傻,因为该工具旨在统一通用的JVM语言并且是在ruby中构建的。除了将输出的jar包含在一个独特的、仅限ruby
在rails源中:https://github.com/rails/rails/blob/master/activesupport/lib/active_support/lazy_load_hooks.rb可以看到以下内容@load_hooks=Hash.new{|h,k|h[k]=[]}在IRB中,它只是初始化一个空哈希。和做有什么区别@load_hooks=Hash.new 最佳答案 查看rubydocumentationforHashnew→new_hashclicktotogglesourcenew(obj)→new_has
我有一个用户工厂。我希望默认情况下确认用户。但是鉴于unconfirmed特征,我不希望它们被确认。虽然我有一个基于实现细节而不是抽象的工作实现,但我想知道如何正确地做到这一点。factory:userdoafter(:create)do|user,evaluator|#unwantedimplementationdetailshereunlessFactoryGirl.factories[:user].defined_traits.map(&:name).include?(:unconfirmed)user.confirm!endendtrait:unconfirmeddoenden
我的主要目标是能够完全理解我正在使用的库/gem。我尝试在Github上从头到尾阅读源代码,但这真的很难。我认为更有趣、更温和的踏脚石就是在使用时阅读每个库/gem方法的源代码。例如,我想知道RubyonRails中的redirect_to方法是如何工作的:如何查找redirect_to方法的源代码?我知道在pry中我可以执行类似show-methodmethod的操作,但我如何才能对Rails框架中的方法执行此操作?您对我如何更好地理解Gem及其API有什么建议吗?仅仅阅读源代码似乎真的很难,尤其是对于框架。谢谢! 最佳答案 Ru
我的假设是moduleAmoduleBendend和moduleA::Bend是一样的。我能够从thisblog找到解决方案,thisSOthread和andthisSOthread.为什么以及什么时候应该更喜欢紧凑语法A::B而不是另一个,因为它显然有一个缺点?我有一种直觉,它可能与性能有关,因为在更多命名空间中查找常量需要更多计算。但是我无法通过对普通类进行基准测试来验证这一点。 最佳答案 这两种写作方法经常被混淆。首先要说的是,据我所知,没有可衡量的性能差异。(在下面的书面示例中不断查找)最明显的区别,可能也是最著名的,是你的
几个月前,我读了一篇关于rubygem的博客文章,它可以通过阅读代码本身来确定编程语言。对于我的生活,我不记得博客或gem的名称。谷歌搜索“ruby编程语言猜测”及其变体也无济于事。有人碰巧知道相关gem的名称吗? 最佳答案 是这个吗:http://github.com/chrislo/sourceclassifier/tree/master 关于ruby-寻找通过阅读代码确定编程语言的rubygem?,我们在StackOverflow上找到一个类似的问题:
我目前正在使用以下方法获取页面的源代码:Net::HTTP.get(URI.parse(page.url))我还想获取HTTP状态,而无需发出第二个请求。有没有办法用另一种方法做到这一点?我一直在查看文档,但似乎找不到我要找的东西。 最佳答案 在我看来,除非您需要一些真正的低级访问或控制,否则最好使用Ruby的内置Open::URI模块:require'open-uri'io=open('http://www.example.org/')#=>#body=io.read[0,50]#=>"["200","OK"]io.base_ur
前言作为一名程序员,自己的本质工作就是做程序开发,那么程序开发的时候最直接的体现就是代码,检验一个程序员技术水平的一个核心环节就是开发时候的代码能力。众所周知,程序开发的水平提升是一个循序渐进的过程,每一位程序员都是从“菜鸟”变成“大神”的,所以程序员在程序开发过程中的代码能力也是根据平时开发中的业务实践来积累和提升的。提高代码能力核心要素程序员要想提高自身代码能力,尤其是新晋程序员的代码能力有很大的提升空间的时候,需要针对性的去提高自己的代码能力。提高代码能力其实有几个比较关键的点,只要把握住这些方面,就能很好的、快速的提高自己的一部分代码能力。1、多去阅读开源项目,如有机会可以亲自参与开源
导读:随着叮咚买菜业务的发展,不同的业务场景对数据分析提出了不同的需求,他们希望引入一款实时OLAP数据库,构建一个灵活的多维实时查询和分析的平台,统一数据的接入和查询方案,解决各业务线对数据高效实时查询和精细化运营的需求。经过调研选型,最终引入ApacheDoris作为最终的OLAP分析引擎,Doris作为核心的OLAP引擎支持复杂地分析操作、提供多维的数据视图,在叮咚买菜数十个业务场景中广泛应用。作者|叮咚买菜资深数据工程师韩青叮咚买菜创立于2017年5月,是一家专注美好食物的创业公司。叮咚买菜专注吃的事业,为满足更多人“想吃什么”而努力,通过美好食材的供应、美好滋味的开发以及美食品牌的孵
matlab打开matlab,用最简单的imread方法读取一个图像clcclearimg_h=imread('hua.jpg');返回一个数组(矩阵),往往是a*b*cunit8类型解释一下这个三维数组的意思,行数、数和层数,unit8:指数据类型,无符号八位整形,可理解为0~2^8的数三个层数分别代表RGB三个通道图像rgb最常用的是24-位实现方法,即RGB每个通道有256色阶(2^8)。基于这样的24-位RGB模型的色彩空间可以表现256×256×256≈1670万色当imshow传入了一个二维数组,它将以灰度方式绘制;可以把图像拆分为rgb三层,可以以灰度的方式观察它figure(1