1、完成K8S集群搭建,搭建参考:
基于ECS云主机搭建k8s集群-详细过程_Soft_Engneer的博客-CSDN博客Kubernetes集群详细部署过程,K8s避坑记录,快速搭建环境并把主要时间花在专注k8s的学习上https://blog.csdn.net/Soft_Engneer/article/details/124517916?spm=1001.2014.3001.55022、完成GlusterFS共享存储部署,搭建参考:
docker pull docker.elastic.co/elasticsearch/elasticsearch:7.17.2
docker pull docker.elastic.co/kibana/kibana:7.17.2
docker pull docker.elastic.co/logstash/logstash:7.17.2
docker pull docker.elastic.co/beats/filebeat:7.17.2
elasticsearch配置文件:
[root@k8s-node01 elk]# more elasticsearch.yml
cluster.name: my-es
node.name: "node-1"
path.data: /usr/share/elasticsearch/data
#path.logs: /var/log/elasticsearch
bootstrap.memory_lock: false
network.host: 0.0.0.0
http.port: 9200
#集群个节点IP地址,也可以使用els、els.shuaiguoxia.com等名称,需要各节点能够解析
#discovery.zen.ping.unicast.hosts: ["172.16.30.11", "172.17.77.12"]
#集群节点数
#discovery.zen.minimum_master_nodes: 2
discovery.seed_hosts: ["127.0.0.1", "[::1]"]
cluster.initial_master_nodes: ["node-1"]
#增加参数,使head插件可以访问es
http.cors.enabled: true
http.cors.allow-origin: "*"
http.cors.allow-headers: Authorization,X-Requested-With,Content-Length,Content-Type
kibana配置文件:
kibana连接的主机使用了域名,是由有状态应用statefulset创建的Pod
[root@k8s-node01 elk]# more kibana.yml
server.port: 5601
server.host: "0.0.0.0"
elasticsearch.hosts: "http://es-kibana-0.es-kibana.kube-system:9200"
kibana.index: ".kibana"
创建elasticsearch和kibana的配置文件configmap:
kubectl create configmap es-config -n kube-system --from-file=elasticsearch.yml
kubectl create configmap kibana-config -n kube-system --from-file=kibana.yml
创建glusterfs存储,用于创建pv:
es-volume存储卷已创建,那么需要创建endpoint和svc:
es-endpoints.yaml
es-glusterfs-svc.yaml
[root@k8s-node01 elk]# more es-endpoints.yaml
apiVersion: v1
kind: Endpoints
metadata:
  name: glusterfs-es
  namespace: kube-system
subsets:
- addresses:
  - ip: 192.168.16.5
  ports:
  - port: 49155
- addresses:
  - ip: 192.168.16.4
  ports:
  - port: 49155
- addresses:
  - ip: 172.17.22.4
  ports:
  - port: 49155
[root@k8s-node01 elk]#
[root@k8s-node01 elk]# more es-glusterfs-svc.yaml
apiVersion: v1
kind: Service
metadata:
  name: glusterfs-es
  namespace: kube-system
spec:
  ports:
  - port: 49155

[root@k8s-node01 elk]#
创建服务:
[root@k8s-node01 elk]# kubectl create -f es-endpoints.yaml
[root@k8s-node01 elk]# kubectl create -f es-glusterfs-svc.yaml
es存储pvc,pv配置文件:es-pv.yaml和es-pvc.yaml
[root@k8s-node01 elk]# more es-pv.yaml
apiVersion: v1
kind: PersistentVolume
metadata:
  name: es-pv
  namespace: kube-system
spec:
  capacity:
    storage: 5Gi
  accessModes:
    - ReadWriteMany
  glusterfs:
    endpoints: "glusterfs-es"
    path: "es-volume"
    readOnly: false

[root@k8s-node01 elk]# more es-pvc.yaml
kind: PersistentVolumeClaim
apiVersion: v1
metadata:
  name: es-pv-claim
  namespace: kube-system
  labels:
    app: es
spec:
  accessModes:
    - ReadWriteMany
  resources:
    requests:
      storage: 5Gi

[root@k8s-node01 elk]#
创建pvc、pv:
[root@k8s-node01 elk]#
[root@k8s-node01 elk]# kubectl apply -f es-pv.yaml
persistentvolume/es-pv created
[root@k8s-node01 elk]# kubectl apply -f es-pvc.yaml
persistentvolumeclaim/es-pv-claim created
[root@k8s-node01 elk]#
[root@k8s-node01 elk]# kubectl get pv,pvc -A
NAME                          CAPACITY   ACCESS MODES   RECLAIM POLICY   STATUS   CLAIM                     STORAGECLASS   REASON   AGE
persistentvolume/es-pv        5Gi        RWX            Retain           Bound    kube-system/es-pv-claim                           26s
persistentvolume/prometheus   4Gi        RWX            Retain           Bound    prome-system/prometheus                           23h

NAMESPACE      NAME                                STATUS   VOLUME       CAPACITY   ACCESS MODES   STORAGECLASS   AGE
kube-system    persistentvolumeclaim/es-pv-claim   Bound    es-pv        5Gi        RWX                           22s
prome-system   persistentvolumeclaim/prometheus    Bound    prometheus   4Gi        RWX                           23h
创建es-kibana的yaml配置文件: es-statefulset.yaml
[root@k8s-node01 elk]# more es-statefulset.yaml
apiVersion: apps/v1
kind: StatefulSet
metadata:
  labels:
    app: es-kibana
  name: es-kibana
  namespace: kube-system
spec:
  replicas: 1
  selector:
    matchLabels:
      app: es-kibana
  serviceName: "es-kibana"
  template:
    metadata:
      labels:
        app: es-kibana
    spec:
      imagePullSecrets:
      - name: registry-pull-secret
      containers:
      - image: elasticsearch:7.17.2
        imagePullPolicy: IfNotPresent
        lifecycle:
          postStart:
            exec:
              command: [ "/bin/bash", "-c", "sysctl -w vm.max_map_count=262144; ulimit -l unlimited;chown -R elasticsearch:elasticsearch /usr/share/elasticsearch/da
ta;" ]
        name: elasticsearch
        resources:
          requests:
            memory: "800Mi"
            cpu: "800m"
          limits:
            memory: "1Gi"
            cpu: "1000m"
        ports:
        - containerPort: 9200
        - containerPort: 9300
        volumeMounts:
        - name: es-config
          mountPath: /usr/share/elasticsearch/config/elasticsearch.yml
          subPath: elasticsearch.yml
        - name: es-persistent-storage
          mountPath: /usr/share/elasticsearch/data
        env:
        - name: TZ
          value: Asia/Shanghai
      - image: kibana:7.17.2
        imagePullPolicy: IfNotPresent
        #command: [ "/bin/bash", "-ce", "tail -f /dev/null" ]
        name: kibana
        env:
        - name: TZ
          value: Asia/Shanghai
        volumeMounts:
        - name: kibana-config
          mountPath: /usr/share/kibana/config/kibana.yml
          subPath: kibana.yml
      volumes:
      - name: es-config
        configMap:
          name: es-config
      - name: kibana-config
        configMap:
          name: kibana-config
      - name: es-persistent-storage
        persistentVolumeClaim:
          claimName: es-pv-claim
      #hostNetwork: true
      #dnsPolicy: ClusterFirstWithHostNet
      # nodeSelector:
      #            kubernetes.io/hostname: 172.16.30.1
创建es-kibana应用:
[root@k8s-node01 elk]# kubectl create -f es-statefulset.yaml
statefulset.apps/es-kibana created
[root@k8s-node01 elk]#
[root@k8s-node01 elk]# kubectl get pod -o wide -n kube-system|grep es
es-kibana-0                          2/2     Running   0            18s   10.244.1.22    k8s-node01   <none>           <none>
[root@k8s-node01 elk]#
[root@k8s-node01 elk]#
使用curl命令测试elasticsearch是否正常:(es-kibana-0这个pod的IP:10.244.1.22)
[root@k8s-node01 elk]# kubectl get pod -o wide -n kube-system|grep es
es-kibana-0                          2/2     Running   0            18s   10.244.1.22    k8s-node01   <none>           <none>
[root@k8s-node01 elk]#
[root@k8s-node01 elk]# curl 10.244.1.22:9200
{
  "name" : "node-1",
  "cluster_name" : "my-es",
  "cluster_uuid" : "0kCaXU_CSpi4yByyW0utsA",
  "version" : {
    "number" : "7.17.2",
    "build_flavor" : "default",
    "build_type" : "docker",
    "build_hash" : "de7261de50d90919ae53b0eff9413fd7e5307301",
    "build_date" : "2022-03-28T15:12:21.446567561Z",
    "build_snapshot" : false,
    "lucene_version" : "8.11.1",
    "minimum_wire_compatibility_version" : "6.8.0",
    "minimum_index_compatibility_version" : "6.0.0-beta1"
  },
  "tagline" : "You Know, for Search"
}
[root@k8s-node01 elk]#
创建es-kibana的cluserip的svc:es-cluster-none-svc.yaml
[root@k8s-node01 elk]# more es-cluster-none-svc.yaml
apiVersion: v1
kind: Service
metadata:
  labels:
    app: es-kibana
  name: es-kibana
  namespace: kube-system
spec:
  ports:
  - name: es9200
    port: 9200
    protocol: TCP
    targetPort: 9200
  - name: es9300
    port: 9300
    protocol: TCP
    targetPort: 9300
  clusterIP: None
  selector:
    app: es-kibana
  type: ClusterIP
[root@k8s-node01 elk]#
[root@k8s-node01 elk]# kubectl apply -f es-cluster-none-svc.yaml
service/es-kibana created
[root@k8s-node01 elk]#
[root@k8s-node01 elk]# kubectl get svc -n kube-system|grep es-kibana
es-kibana      ClusterIP   None            <none>        9200/TCP,9300/TCP        29s
[root@k8s-node01 elk]#
[root@k8s-node01 elk]#
创建完以后kiban及可以正常连接elasticsearch了
为了查看方便创建一个nodeport类型的svc:es-nodeport-svc.yaml
[root@k8s-node01 elk]# more es-nodeport-svc.yaml
apiVersion: v1
kind: Service
metadata:
  labels:
    app: es-kibana
  name: es-kibana-nodeport-svc
  namespace: kube-system
spec:
  ports:
  - name: 9200-9200
    port: 9200
    protocol: TCP
    targetPort: 9200
    #nodePort: 9200
  - name: 5601-5601
    port: 5601
    protocol: TCP
    targetPort: 5601
    #nodePort: 5601
  selector:
    app: es-kibana
  type: NodePort
[root@k8s-node01 elk]# kubectl apply -f es-nodeport-svc.yaml
service/es-kibana-nodeport-svc created
[root@k8s-node01 elk]#
[root@k8s-node01 elk]# kubectl get svc -n kube-system|grep es-kibana
es-kibana                ClusterIP   None             <none>        9200/TCP,9300/TCP               3m39s
es-kibana-nodeport-svc   NodePort    10.110.159.163   <none>        9200:30519/TCP,5601:32150/TCP   13s
[root@k8s-node01 elk]#
[root@k8s-node01 elk]#
使用nodeip+port访问,本次端口为32150
页面显示正常即可

logstash.yml配置文件,输出至es使用域名配置:
[root@k8s-node01 elk]# more logstash.yml
http.host: "0.0.0.0"
xpack.monitoring.elasticsearch.hosts: http://es-kibana-0.es-kibana.kube-system:9200
logstash.conf配置文件:
[root@k8s-node01 elk]# more logstash.conf
input {
  beats {
     port => 5044
     client_inactivity_timeout => 36000
  }
}

filter {
 #需要配置否则host是一个json不是文本则无法输出至elasticsearch
  mutate {
    rename => { "[host][name]" => "host" }
  }
}

output {
           elasticsearch {
              hosts => ["http://es-kibana-0.es-kibana.kube-system:9200"]
              index => "k8s-system-log-%{+YYYY.MM.dd}"
           }
          stdout{
              codec => rubydebug
           }
}
[root@k8s-node01 elk]#
创建两个配置文件:
kubectl create configmap logstash-yml-config -n kube-system  --from-file=logstash.yml
kubectl create configmap logstash-config -n kube-system  --from-file=logstash.conf
logstash的yaml配置文件:
[root@k8s-node01 elk]# more logstash-statefulset.yaml
apiVersion: apps/v1
kind: StatefulSet
metadata:
  labels:
    app: logstash
  name: logstash
  namespace: kube-system
spec:
  serviceName: "logstash"
  replicas: 1
  selector:
    matchLabels:
      app: logstash
  template:
    metadata:
      labels:
        app: logstash
    spec:
      imagePullSecrets:
      - name: registry-pull-secret
      containers:
      - image: logstash:7.17.2
        name: logstash
        resources:
          requests:
            memory: "500Mi"
            cpu: "400m"
          limits:
            memory: "800Mi"
            cpu: "800m"
        volumeMounts:
        - name: logstash-yml-config
          mountPath: /usr/share/logstash/config/logstash.yml
          subPath: logstash.yml
        - name: logstash-config
          mountPath: /usr/share/logstash/pipeline/logstash.conf
          subPath: logstash.conf
        env:
        - name: TZ
          value: Asia/Shanghai
      volumes:
      - name: logstash-yml-config
        configMap:
          name: logstash-yml-config
      - name: logstash-config
        configMap:
          name: logstash-config
      #nodeSelector:
      # kubernetes.io/hostname: 172.16.30.1
[root@k8s-node01 elk]#
创建logstash应用:
[root@k8s-node01 elk]# kubectl create -f logstash-statefulset.yaml
statefulset.apps/logstash created
[root@k8s-node01 elk]#
[root@k8s-node01 elk]# kubectl get pod -o wide -n kube-system|grep logstash
logstash-0                           1/1     Running   0            24s   10.244.1.23    k8s-node01   <none>           <none>
[root@k8s-node01 elk]#
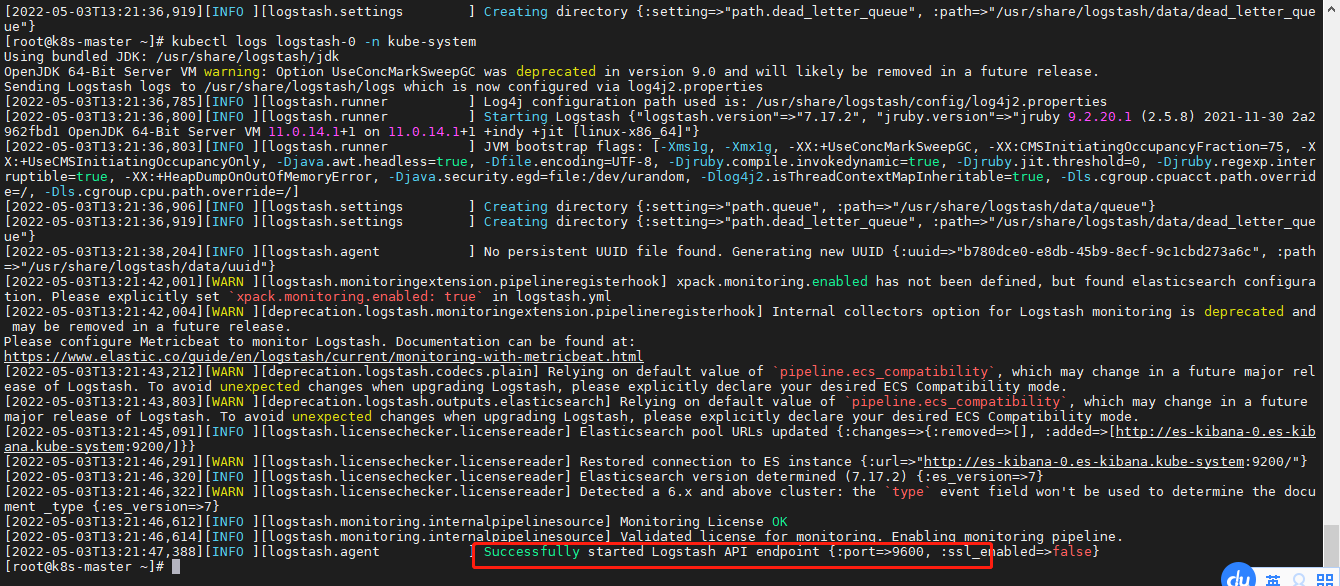
注意:logstash的默认启动端口在9600-9700之间,一般是9600,具体可以查看logstash的日志确认;
logstash的svc配置文件:
[root@k8s-node01 elk]# more logstash-none-svc.yaml
apiVersion: v1
kind: Service
metadata:
  labels:
    app: logstash
  name: logstash
  namespace: kube-system
spec:
  ports:
  - name: logstsh
    port: 5044
    protocol: TCP
    targetPort: 9600
  clusterIP: None
  selector:
    app: logstash
  type: ClusterIP
[root@k8s-node01 elk]#
[root@k8s-node01 elk]# kubectl create -f logstash-none-svc.yaml
service/logstash created
[root@k8s-node01 elk]#
filebeat.yml配置文件:
[root@k8s-node01 elk]# more filebeat.yml
filebeat.inputs:
- type: log
  enabled: true
  paths:
    - /messages
  fields:
    app: k8s
    type: module
filebeat.config.modules:
  path: ${path.config}/modules.d/*.yml
  reload.enabled: false
setup.template.settings:
  index.number_of_shards: 3
setup.kibana:
output.logstash:
  hosts: ["logstash-0.logstash.kube-system:5044"]
processors:
  - add_host_metadata:
  - add_cloud_metadata:
[root@k8s-node01 elk]#
解析
容器日志路径为/messages 需要在启动Pod时候把该路径对应挂载
使用的是k8s内部的dns配置elasticsearch服务
创建filebeat的configmap
kubectl create configmap filebeat-config -n kube-system --from-file=filebeat.ymlfilebeat的yaml文件:
[root@k8s-node01 elk]# more filebeat-daemonset.yaml
apiVersion: apps/v1
kind: DaemonSet
metadata:
  labels:
    app: filebeat
  name: filebeat
  namespace: kube-system
spec:
  selector:
    matchLabels:
      app: filebeat
  template:
    metadata:
      labels:
        app: filebeat
    spec:
      imagePullSecrets:
      - name: registry-pull-secret
      containers:
      - image: elastic/filebeat:7.17.2
        name: filebeat
        volumeMounts:
        - name: filebeat-config
          mountPath: /etc/filebeat.yml
          subPath: filebeat.yml
        - name: k8s-system-logs
          mountPath: /messages
        args: [
          "-c", "/etc/filebeat.yml",
          "-e",
        ]
        resources:
          requests:
            cpu: 100m
            memory: 100Mi
          limits:
            cpu: 500m
            memory: 500Mi
        securityContext:
          runAsUser: 0
        env:
        - name: TZ
          value: "CST-8"
      volumes:
      - name: filebeat-config
        configMap:
          name: filebeat-config
      - name: k8s-system-logs
        hostPath:
          path: /var/log/messages
          type: File
[root@k8s-node01 elk]#
使用DaemonSet保证每个node有且仅调度一个Pod用于收集node主机的/var/log/messages日志
[root@k8s-node01 elk]# kubectl apply -f filebeat-daemonset.yaml
daemonset.apps/filebeat created
[root@k8s-node01 elk]#
[root@k8s-node01 elk]#
[root@k8s-node01 elk]# kubectl get pod -o wide -n kube-system|grep filebeat
filebeat-5h58b                       1/1     Running   0            24s     10.244.0.17    k8s-master   <none>           <none>
filebeat-7x9xm                       1/1     Running   0            24s     10.244.1.24    k8s-node01   <none>           <none>
filebeat-z6lwv                       1/1     Running   0            24s     10.244.2.6     k8s-node02   <none>           <none>
[root@k8s-node01 elk]#
在kibana添加日志索引以后查看:
到discover页面,创建索引模式,“k8s-system-log-*” ,选择时间"timestamp",然后,就可以看到日志了
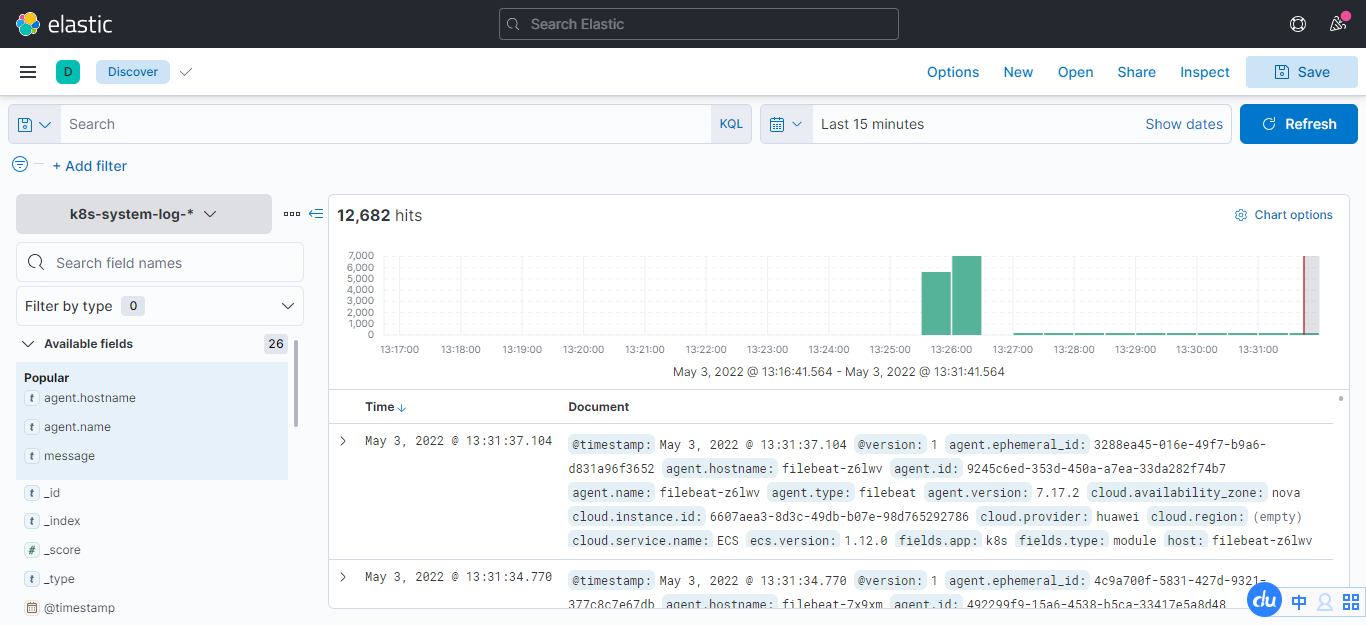
ELK日志系统搭建完成!
这篇博文写的不错,本文参考:k8s之使用k8s搭建ELK日志收集系统 - minseo - 博客园
有没有人得到Logstash在Rails上使用ruby?我的客户告诉我将Logstash用于日志收集器等。我正在使用rubyonrails技术。大部分都快完成了。但要求是将日志记录到logstash中。请让我知道这可能吗? 最佳答案 我为此编写了一个gem-logstasher.它将Rails日志写入一个单独的文件,采用纯json格式,无需任何处理即可由logstash使用。查看我的blog有关如何设置Logstash和Kibana的完整说明 关于ruby-on-rails-Lo
在我的场景中,Logstash收到的系统日志行的“时间戳”是UTC,我们在Elasticsearch输出中使用事件“时间戳”:output{elasticsearch{embedded=>falsehost=>localhostport=>9200protocol=>httpcluster=>'elasticsearch'index=>"syslog-%{+YYYY.MM.dd}"}}我的问题是,在UTC午夜,Logstash在外时区(GMT-4=>America/Montreal)结束前将日志发送到不同的索引,并且索引在20小时(晚上8点)之后没有日志,因为“时间戳”是UTC。我们已
不知何故,我似乎无法获得包含我的聚合的响应...使用curl它按预期工作:HBZUMB01$curl-XPOST"http://localhost:9200/contents/_search"-d'{"size":0,"aggs":{"sport_count":{"value_count":{"field":"dwid"}}}}'我收到回复:{"took":4,"timed_out":false,"_shards":{"total":5,"successful":5,"failed":0},"hits":{"total":90,"max_score":0.0,"hits":[]},"a
1.回顾.TransportServicepublicclassTransportServiceextendsAbstractLifecycleComponentTransportService:方法:1publicfinalTextendsTransportResponse>voidsendRequest(finalTransport.Connectionconnection,finalStringaction,finalTransportRequestrequest,finalTransportRequestOptionsoptions,TransportResponseHandlerT>
我有一个Rails应用程序,现在设置了ElasticSearch和Tiregem以在模型上进行搜索,我想知道我应该如何设置我的应用程序以对模型中的某些索引进行模糊字符串匹配。我将我的模型设置为索引标题、描述等内容,但我想对其中一些进行模糊字符串匹配,但我不确定在何处进行此操作。如果您想发表评论,我将在下面包含我的代码!谢谢!在Controller中:defsearch@resource=Resource.search(params[:q],:page=>(params[:page]||1),:per_page=>15,load:true)end在模型中:classResource'Us
美团外卖搜索工程团队在Elasticsearch的优化实践中,基于Location-BasedService(LBS)业务场景对Elasticsearch的查询性能进行优化。该优化基于Run-LengthEncoding(RLE)设计了一款高效的倒排索引结构,使检索耗时(TP99)降低了84%。本文从问题分析、技术选型、优化方案等方面进行阐述,并给出最终灰度验证的结论。1.前言最近十年,Elasticsearch已经成为了最受欢迎的开源检索引擎,其作为离线数仓、近线检索、B端检索的经典基建,已沉淀了大量的实践案例及优化总结。然而在高并发、高可用、大数据量的C端场景,目前可参考的资料并不多。因此
开门见山|拉取镜像dockerpullelasticsearch:7.16.1|配置存放的目录#存放配置文件的文件夹mkdir-p/opt/docker/elasticsearch/node-1/config#存放数据的文件夹mkdir-p/opt/docker/elasticsearch/node-1/data#存放运行日志的文件夹mkdir-p/opt/docker/elasticsearch/node-1/log#存放IK分词插件的文件夹mkdir-p/opt/docker/elasticsearch/node-1/plugins若你使用了moba,直接右键新建即可如上图所示依次类推创建
文章目录概念索引相关操作创建索引更新副本查看索引删除索引索引的打开与关闭收缩索引索引别名查询索引别名文档相关操作新建文档查询文档更新文档删除文档映射相关操作查询文档映射创建静态映射创建索引并添加映射概念es中有三个概念要清楚,分别为索引、映射和文档(不用死记硬背,大概有个印象就可以)索引可理解为MySQL数据库;映射可理解为MySQL的表结构;文档可理解为MySQL表中的每行数据静态映射和动态映射上面已经介绍了,映射可理解为MySQL的表结构,在MySQL中,向表中插入数据是需要先创建表结构的;但在es中不必这样,可以直接插入文档,es可以根据插入的文档(数据),动态的创建映射(表结构),这就
我有一个关于配置elasticsearch以连接AWSelasticsearch服务以在生产环境中运行项目的问题。我的gem文件:gem'searchkick'gem'faraday_middleware-aws-signers-v4'gem'aws-sdk','~>2'gem"elasticsearch",">=1.0.15"引用:https://github.com/ankane/searchkick我的config/initializers/elasticsearch.rb文件:require"faraday_middleware/aws_signers_v4"ENV["ELAS
elasticsearch查看当前集群中的master节点是哪个需要使用_cat监控命令,具体如下。查看方法es主节点确定命令,以kibana上查看示例如下:GET_cat/nodesv返回结果示例如下:ipheap.percentram.percentcpuload_1mload_5mload_15mnode.rolemastername172.16.16.188529952.591.701.45mdi-elastic3172.16.16.187329950.990.991.19mdi-elastic2172.16.16.231699940.871.001.03mdi-elastic4172