大家好,我是无名小歌,欢迎加入云社区
今天给大家分享一个centos7系统搭建2022年最新ELK日志分析系统,目前版本是8.2.2。值得注意的是安装 ELK 时,您必须在整个ELK中使用相同的版本,如:Elasticsearch 8.2.2,则安装Kibana 8.2.2 和 Logstash 8.2.2,如果出现不对应的情况,如:Elasticsearch 是8.2.2版本、Kibana-6.8等或是其他版本,则需要进行对应版本的升级到8.2.2版本。
就说这么多,下面正式开始吧!!!

日志是非结构化的数据(数据量大,不易查询),这也是使用ELK的主要原因之一。
本次教程采用单节点方式
| 系统 | 内存 | IP | 网卡模式 |
|---|---|---|---|
| Linux | 12G | 192.168.200.4 | NAT |
推荐内存12G,以下ELK系统占用内存为 接近8G,所以只要大于8G应该问题不大,但为了保证体验推荐10G、12G。
cat >> /etc/security/limits.conf << EOF
hard nofile 65535
soft nofile 65535
EOF
cat >> /etc/sysctl.conf << EOF
vm.max_map_count=262144
EOF
sysctl -p
rpm --import https://artifacts.elastic.co/GPG-KEY-elasticsearch
cat >> /etc/yum.repos.d/ELK.repo << EOF
[elasticsearch]
name=Elasticsearch repository for 8.x packages
baseurl=https://artifacts.elastic.co/packages/8.x/yum
gpgcheck=1
gpgkey=https://artifacts.elastic.co/GPG-KEY-elasticsearch
enabled=0
autorefresh=1
type=rpm-md
EOF
注意看安装完成后会出现 Security autoconfiguration information 字段(安全自动配置信息)
安装 Elasticsearch 时,默认启用并配置安全功能,会自动进行以下安全配置:
- 启用身份验证和授权,并为elastic内置超级用户生成密码。
- 为传输层和 HTTP 层生成 TLS 的证书和密钥,并使用这些密钥和证书启用和配置 TLS。
过程中如果出现下载中断,继续执行下列命令即可直至完成。
$ yum install --enablerepo=elasticsearch elasticsearch -y
...
...
--------------------------- Security autoconfiguration information ------------------------------

Authentication and authorization are enabled.
TLS for the transport and HTTP layers is enabled and configured.

#弹性内置超级用户生成的密码为:se_pNHcZwLawBfF7pxUs
The generated password for the elastic built-in superuser is : se_pNHcZwLawBfF7pxUs

#如果此节点应加入现有群集,则可以使用下列命令
If this node should join an existing cluster, you can reconfigure this with
'/usr/share/elasticsearch/bin/elasticsearch-reconfigure-node --enrollment-token <token-here>'
after creating an enrollment token on your existing cluster.

You can complete the following actions at any time:

#重置弹性内置超级用户的密码
Reset the password of the elastic built-in superuser with
'/usr/share/elasticsearch/bin/elasticsearch-reset-password -u elastic'.

#使用为Kibana实例生成注册令牌
Generate an enrollment token for Kibana instances with
 '/usr/share/elasticsearch/bin/elasticsearch-create-enrollment-token -s kibana'.

#使用为Elasticsearch节点生成注册令牌
Generate an enrollment token for Elasticsearch nodes with
'/usr/share/elasticsearch/bin/elasticsearch-create-enrollment-token -s node'.

-------------------------------------------------------------------------------------------------
### NOT starting on installation, please execute the following statements to configure elasticsearch service to start automatically using systemd
#自启动命令
 sudo systemctl daemon-reload
 sudo systemctl enable elasticsearch.service
### You can start elasticsearch service by executing
#启动命令
 sudo systemctl start elasticsearch.service
使用上述生成的启动命令,启动也需要等待一段时间,这里内存占用大约6G。
sudo systemctl daemon-reload
sudo systemctl enable elasticsearch.service
sudo systemctl start elasticsearch.service
这里你会发现我们浏览器使用http协议是不能访问的,并不是我们服务有问题。
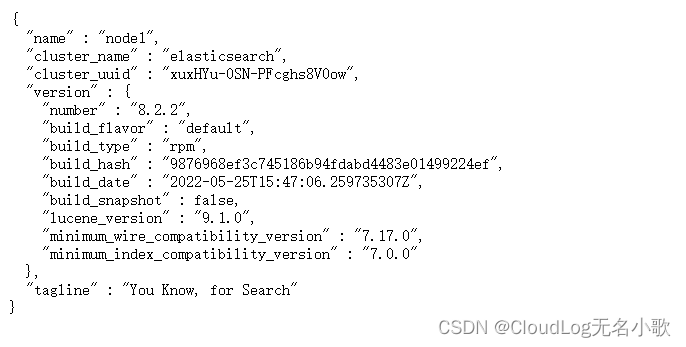
本地宿主机访问Elasticsearch,服务端口9200:
$ curl --cacert /etc/elasticsearch/certs/http_ca.crt -u elastic https://localhost:9200
Enter host password for user 'elastic':
{
  "name" : "node1",
  "cluster_name" : "elasticsearch",
  "cluster_uuid" : "xuxHYu-0SN-PFcghs8V0ow",
  "version" : {
    "number" : "8.2.2",
    "build_flavor" : "default",
    "build_type" : "rpm",
    "build_hash" : "9876968ef3c745186b94fdabd4483e01499224ef",
    "build_date" : "2022-05-25T15:47:06.259735307Z",
    "build_snapshot" : false,
    "lucene_version" : "9.1.0",
    "minimum_wire_compatibility_version" : "7.17.0",
    "minimum_index_compatibility_version" : "7.0.0"
  },
  "tagline" : "You Know, for Search"
}
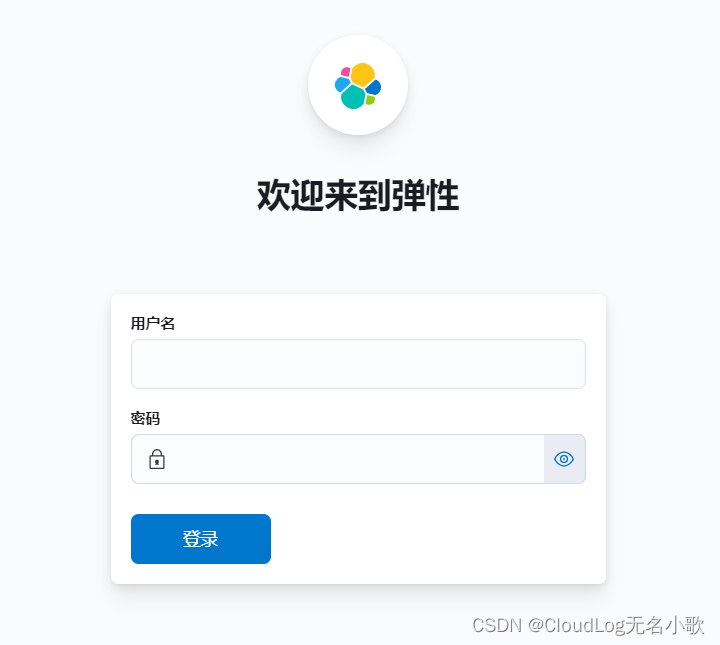
浏览器访问Elasticsearch,服务端口9200,如:https://192.168.200.4:9200
浏览器访问请注意,Elasticsearch-8.2.2版本,如果使用http协议是无法访问的必须使用https协议。
用户名:elastic
密码:se_pNHcZwLawBfF7pxUs
注意:这里浏览器会出现提示不安全的情况(不要慌)依次点击:高级–>接收风险,就会跳转到登录界面了。
密码对应弹性内置超级用户生成的密码。
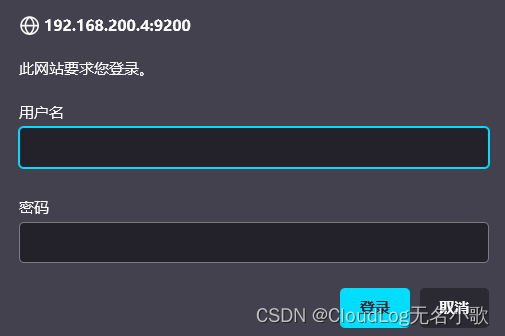
出现和本地访问的内容是一致的,这样我们的Elasticsearch安装完成。
cat >> /etc/yum.repos.d/ELK.repo << EOF
[kibana-8.x]
name=Kibana repository for 8.x packages
baseurl=https://artifacts.elastic.co/packages/8.x/yum
gpgcheck=1
gpgkey=https://artifacts.elastic.co/GPG-KEY-elasticsearch
enabled=1
autorefresh=1
type=rpm-md
EOF
过程中如果出现下载中断,继续执行下列命令即可直至完成。
yum install kibana -y
解除注释:server.port、server.host
server.host:填写自己主机ip

sudo /bin/systemctl daemon-reload
sudo /bin/systemctl enable kibana.service
sudo systemctl start kibana.service
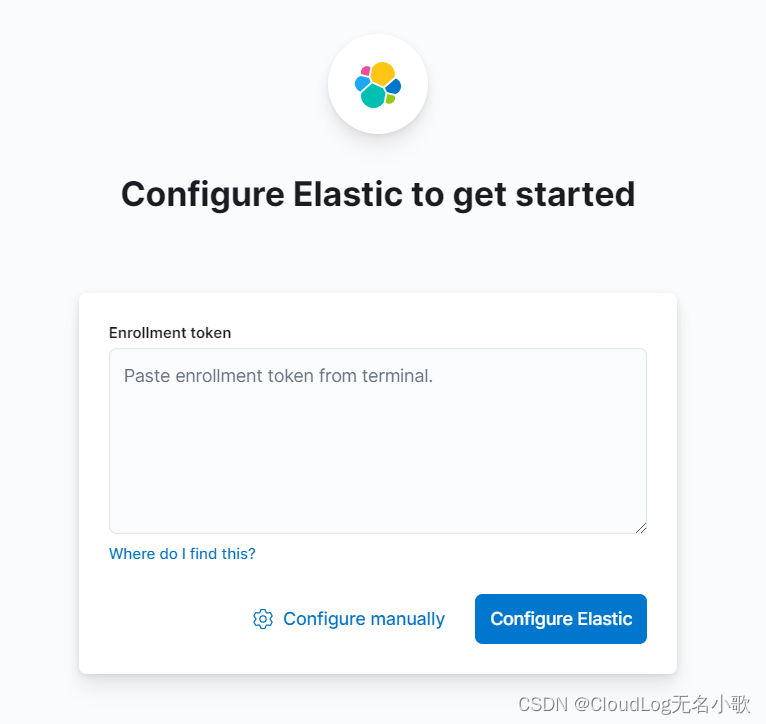
http://192.168.200.4:5601/访问Kibana时,使用http协议是可以访问的,https协议不能访问。
如下图:kibana-8.2.2版本需要令牌登录,下面使用命令生成令牌。
注意:如果访问时出现下列问题,点击解决方法。

elasticsearch-create-enrollment-token命令为Kibana生成一个注册令牌:输入注册令牌,将 Kibana 与 Elasticsearch 连接起来。
下列命令是安装elasticsearch时安全自动配置信息中所生成。
/usr/share/elasticsearch/bin/elasticsearch-create-enrollment-token -s kibana
kibana-verification-code命令生成验证码输入验证码之后,kibana会进行:保存设置–>启动elastic–>完成设置操作。
$ /usr/share/kibana/bin/kibana-verification-code
Your verification code is:  409 686
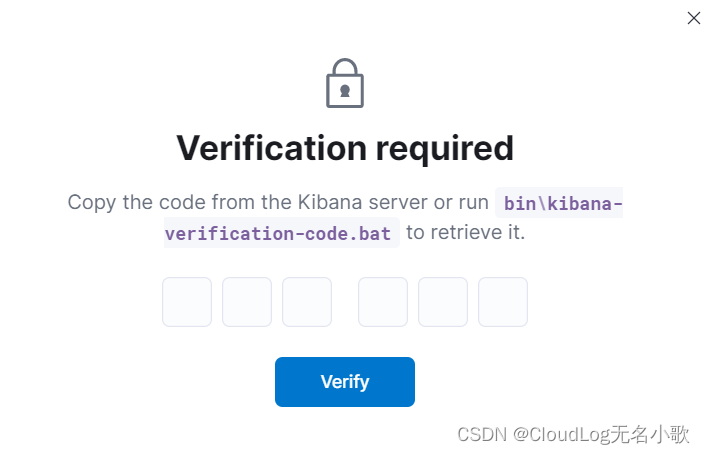
用户密码使用安装elasticsearch时生成的用户密码。
用户名:elastic
密码:se_pNHcZwLawBfF7pxUs
cat >> /etc/yum.repos.d/ELK.repo << EOF
[logstash-8.x]
name=Elastic repository for 8.x packages
baseurl=https://artifacts.elastic.co/packages/8.x/yum
gpgcheck=1
gpgkey=https://artifacts.elastic.co/GPG-KEY-elasticsearch
enabled=1
autorefresh=1
type=rpm-md
EOF
过程中如果出现下载中断,继续执行下列命令即可直至完成。
yum install logstash -y
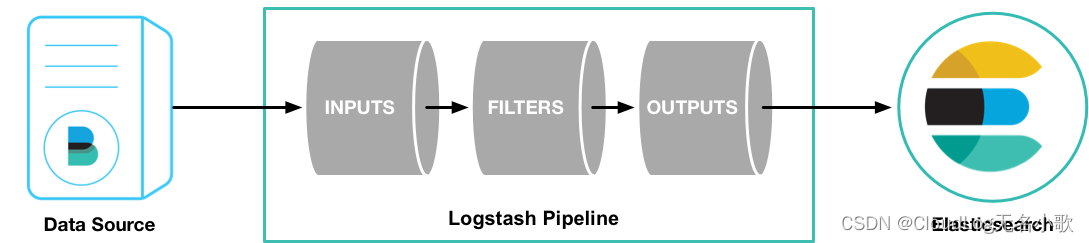
我们通过运行最基本的Logstash Pipeline来测试。
Logstash 管道具有两个必需元素input和output和一个可选元素filter。
运行步骤:输入插件使用来自源的数据,过滤器插件根据您的指定修改数据,输出插件将数据写入目标。
运行 Logstash Pipeline
输出内容第8行出现
Successfully started Logstash API endpoint,说明成功启动Logstash
stdin 插件出现等待输入提示(The stdin plugin is now waiting for input:),输入 hello world 测试。
Ctrl+D 退出 Logstash Pipeline
[root@node1 ~]# /usr/share/logstash/bin/logstash -e 'input { stdin { } } output { stdout {} }'
Using bundled JDK: /usr/share/logstash/jdk
OpenJDK 64-Bit Server VM warning: Option UseConcMarkSweepGC was deprecated in version 9.0 and will likely be removed in a future release.
WARNING: Could not find logstash.yml which is typically located in $LS_HOME/config or /etc/logstash. You can specify the path using --path.settings. Continuing using the defaults
Could not find log4j2 configuration at path /usr/share/logstash/config/log4j2.properties. Using default config which logs errors to the console
[INFO ] 2022-05-30 10:19:11.092 [main] runner - Starting Logstash {"logstash.version"=>"8.2.2", "jruby.version"=>"jruby 9.2.20.1 (2.5.8) 2021-11-30 2a2962fbd1 OpenJDK 64-Bit Server VM 11.0.14.1+1 on 11.0.14.1+1 +indy +jit [linux-x86_64]"}
[INFO ] 2022-05-30 10:19:11.110 [main] runner - JVM bootstrap flags: [-Xms1g, -Xmx1g, -XX:+UseConcMarkSweepGC, -XX:CMSInitiatingOccupancyFraction=75, -XX:+UseCMSInitiatingOccupancyOnly, -Djava.awt.headless=true, -Dfile.encoding=UTF-8, -Djruby.compile.invokedynamic=true, -Djruby.jit.threshold=0, -XX:+HeapDumpOnOutOfMemoryError, -Djava.security.egd=file:/dev/urandom, -Dlog4j2.isThreadContextMapInheritable=true, -Djruby.regexp.interruptible=true, -Djdk.io.File.enableADS=true, --add-opens=java.base/java.security=ALL-UNNAMED, --add-opens=java.base/java.io=ALL-UNNAMED, --add-opens=java.base/java.nio.channels=ALL-UNNAMED, --add-opens=java.base/sun.nio.ch=ALL-UNNAMED, --add-opens=java.management/sun.management=ALL-UNNAMED]
[WARN ] 2022-05-30 10:19:12.090 [LogStash::Runner] multilocal - Ignoring the 'pipelines.yml' file because modules or command line options are specified
[INFO ] 2022-05-30 10:19:15.968 [Api Webserver] agent - Successfully started Logstash API endpoint {:port=>9600, :ssl_enabled=>false}
[INFO ] 2022-05-30 10:19:17.783 [Converge PipelineAction::Create<main>] Reflections - Reflections took 272 ms to scan 1 urls, producing 120 keys and 395 values
[INFO ] 2022-05-30 10:19:19.375 [Converge PipelineAction::Create<main>] javapipeline - Pipeline `main` is configured with `pipeline.ecs_compatibility: v8` setting. All plugins in this pipeline will default to `ecs_compatibility => v8` unless explicitly configured otherwise.
[INFO ] 2022-05-30 10:19:19.723 [[main]-pipeline-manager] javapipeline - Starting pipeline {:pipeline_id=>"main", "pipeline.workers"=>4, "pipeline.batch.size"=>125, "pipeline.batch.delay"=>50, "pipeline.max_inflight"=>500, "pipeline.sources"=>["config string"], :thread=>"#<Thread:0x7c068ea7 run>"}
[INFO ] 2022-05-30 10:19:21.346 [[main]-pipeline-manager] javapipeline - Pipeline Java execution initialization time {"seconds"=>1.61}
[INFO ] 2022-05-30 10:19:21.520 [[main]-pipeline-manager] javapipeline - Pipeline started {"pipeline.id"=>"main"}

# stdin 插件出现等待输入提示,请输入hello world
The stdin plugin is now waiting for input:

hello world
{
      "@version" => "1",
         "event" => {
        "original" => "hello world"
    },
       "message" => "hello world",
    "@timestamp" => 2022-05-30T02:27:01.888886Z,
          "host" => {
        "hostname" => "node1"
    }
}
ELK-8.2.2版本日志分析系统自此搭建完成!!!
我是无名小歌,欢迎大家一键三连、加入云社区
(⊙o⊙),我们下期再见!!!
https://www.elastic.co/guide/index.html
导读语言模型给我们的生产生活带来了极大便利,但同时不少人也利用他们从事作弊工作。如何规避这些难辨真伪的文字所产生的负面影响也成为一大难题。在3月9日智源Live第33期活动「DetectGPT:判断文本是否为机器生成的工具」中,主讲人Eric为我们讲解了DetectGPT工作背后的思路——一种基于概率曲率检测的用于检测模型生成文本的工具,它可以帮助我们更好地分辨文章的来源和可信度,对保护信息真实、防止欺诈等方面具有重要意义。本次报告主要围绕其功能,实现和效果等展开。(文末点击“阅读原文”,查看活动回放。)Ericmitchell斯坦福大学计算机系四年级博士生,由ChelseaFinn和Chri
电脑0x0000001A蓝屏错误怎么U盘重装系统教学分享。有用户电脑开机之后遇到了系统蓝屏的情况。系统蓝屏问题很多时候都是系统bug,只有通过重装系统来进行解决。那么蓝屏问题如何通过U盘重装新系统来解决呢?来看看以下的详细操作方法教学吧。 准备工作: 1、U盘一个(尽量使用8G以上的U盘)。 2、一台正常联网可使用的电脑。 3、ghost或ISO系统镜像文件(Win10系统下载_Win10专业版_windows10正式版下载-系统之家)。 4、在本页面下载U盘启动盘制作工具:系统之家U盘启动工具。 U盘启动盘制作步骤: 注意:制作期间,U盘会被格式化,因此U盘中的重要文件请注
在应用开发中,有时候我们需要获取系统的设备信息,用于数据上报和行为分析。那在鸿蒙系统中,我们应该怎么去获取设备的系统信息呢,比如说获取手机的系统版本号、手机的制造商、手机型号等数据。1、获取方式这里分为两种情况,一种是设备信息的获取,一种是系统信息的获取。1.1、获取设备信息获取设备信息,鸿蒙的SDK包为我们提供了DeviceInfo类,通过该类的一些静态方法,可以获取设备信息,DeviceInfo类的包路径为:ohos.system.DeviceInfo.具体的方法如下:ModifierandTypeMethodDescriptionstatic StringgetAbiList()Obt
?博客主页:https://xiaoy.blog.csdn.net?本文由呆呆敲代码的小Y原创,首发于CSDN??学习专栏推荐:Unity系统学习专栏?游戏制作专栏推荐:游戏制作?Unity实战100例专栏推荐:Unity实战100例教程?欢迎点赞?收藏⭐留言?如有错误敬请指正!?未来很长,值得我们全力奔赴更美好的生活✨------------------❤️分割线❤️-------------------------
需求:要创建虚拟机,就需要给他提供一个虚拟的磁盘,我们就在/opt目录下创建一个10G大小的raw格式的虚拟磁盘CentOS-7-x86_64.raw命令格式:qemu-imgcreate-f磁盘格式磁盘名称磁盘大小qemu-imgcreate-f磁盘格式-o?1.创建磁盘qemu-imgcreate-fraw/opt/CentOS-7-x86_64.raw10G执行效果#ls/opt/CentOS-7-x86_64.raw2.安装虚拟机使用virt-install命令,基于我们提供的系统镜像和虚拟磁盘来创建一个虚拟机,另外在创建虚拟机之前,提前打开vnc客户端,在创建虚拟机的时候,通过vnc
因为我现在正在做一些时间测量,我想知道是否可以在不使用Benchmark类或命令行实用程序time的情况下测量用户时间或系统时间。使用Time类只显示挂钟时间,而不显示系统和用户时间,但是我正在寻找具有相同灵active的解决方案,例如time=TimeUtility.now#somecodeuser,system,real=TimeUtility.now-time原因是我有点不喜欢Benchmark,因为它不能只返回数字(编辑:我错了-它可以。请参阅下面的答案。)。当然,我可以解析输出,但感觉不对。*NIX系统的time实用程序也应该可以解决我的问题,但我想知道是否已经在Ruby中实
在Ruby中,以毫秒为单位获取自纪元(1970)以来的当前系统时间的正确方法是什么?我试过了Time.now.to_i,好像不是我想要的结果。我需要结果显示毫秒并且使用long类型,而不是float或double。 最佳答案 (Time.now.to_f*1000).to_iTime.now.to_f显示包含十进制数字的时间。要获得毫秒数,只需将时间乘以1000。 关于ruby-以毫秒为单位获取当前系统时间,我们在StackOverflow上找到一个类似的问题:
如何在出现异常时指定全局救援,如果您将Sinatra用于API或应用程序,您将如何处理日志记录? 最佳答案 404可以在not_found方法的帮助下处理,例如:not_founddo'Sitedoesnotexist.'end500s可以通过调用带有block的错误方法来处理,例如:errordo"Applicationerror.Plstrylater."end错误的详细信息可以通过request.env中的sinatra.error访问,如下所示:errordo'Anerroroccured:'+request.env['si
我正在使用ruby标准记录器,我想要每天轮换一次,所以在我的代码中我有:Logger.new("#{$ROOT_PATH}/log/errors.log",'daily')它运行完美,但它创建了两个文件errors.log.20130217和errors.log.20130217.1。如何强制它每天只创建一个文件? 最佳答案 您的代码对于长时间运行的应用程序是正确的。发生的事情是您在给定的一天多次运行代码。第一次运行时,Ruby会创建一个日志文件“errors.log”。当日期改变时,Ruby将文件重命名为“errors.log
在运行Cucumber测试时,我得到(除了测试结果)大量调试/日志相关的输出形式:D,[2013-03-06T12:21:38.911829#49031]DEBUG--:SOAPrequest:D,[2013-03-06T12:21:38.911919#49031]DEBUG--:Pragma:no-cache,SOAPAction:"",Content-Type:text/xml;charset=UTF-8,Content-Length:1592W,[2013-03-06T12:21:38.912360#49031]WARN--:HTTPIexecutesHTTPPOSTusingt