 当我们使用 Prometheus 来监控 Kubernetes 集群的时候,kube-state-metrics(KSM) 基本属于一个必备组件,它通过 Watch APIServer 来生成资源对象的状态指标,它并不会关注单个 Kubernetes 组件的健康状况,而是关注各种资源对象的健康状态,比如 Deployment、Node、Pod、Ingress、Job、Service 等等,每种资源对象中包含了需要指标,我们可以在官方文档 https://github.com/kubernetes/kube-state-metrics/tree/main/docs 处进行查看。要安装 KSM 也非常简单,代码仓库中就包含了对应的资源清单文件,但是在安装的时候记得要和你的 K8s 集群版本对应。
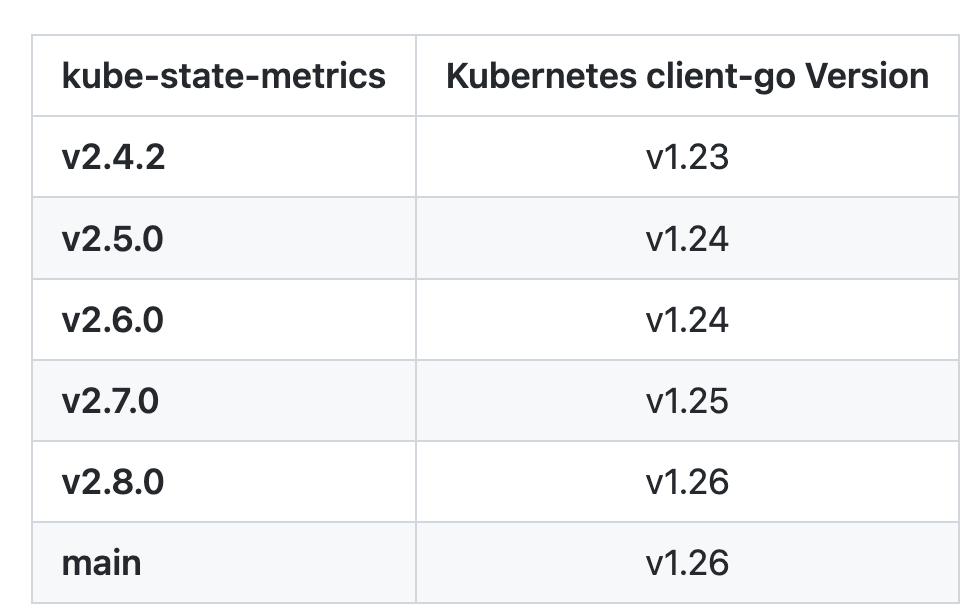 我这里的测试集群是 v1.25 版本的,所以我先切换到该分支:
$ git clone https://github.com/kubernetes/kube-state-metrics && cd kube-state-metrics
$ git checkout v2.7.0
$ kubectl apply -f examples/standard$ kubectl get deploy -n kube-system kube-state-metrics
NAME READY UP-TO-DATE AVAILABLE AGE
kube-state-metrics 1/1 1 1 2m49s
$ kubectl get pods -n kube-system -l app.kubernetes.io/name=kube-state-metrics
NAME READY STATUS RESTARTS AGE
kube-state-metrics-548546fc89-zgkx5 1/1 Running 0 2m51s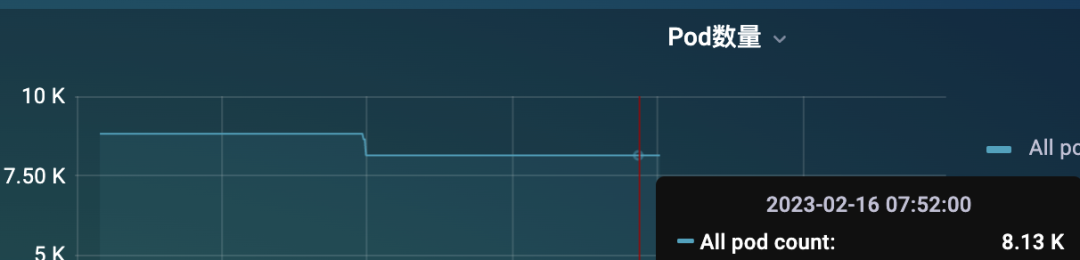 但是只通过一个 KSM 实例来提供 metrics 指标还是非常吃力的,这个时候可能大部分情况下是获取不到指标的,因为 metrics 接口里面的数据量太大了。
 即使偶尔获取到了,也需要话花很长时间,要知道我们会每隔 scrape_interval 的时间都会去访问该指标接口的,可能前面一次请求还没结束,下一次请求又发起了,要解决这个问题就得从 KSM 端入手解决,在 KSM 的启动参数中我们可以配置过滤掉一些不需要的指标标签:
$ kube-state-metrics -h
kube-state-metrics is a simple service that listens to the Kubernetes API server and generates metrics about the state of the objects.

Usage:
  kube-state-metrics [flags]
  kube-state-metrics [command]

Available Commands:
  completion  Generate completion script for kube-state-metrics.
  help        Help about any command
  version     Print version information.

Flags:
      --add_dir_header                             If true, adds the file directory to the header of the log messages
      --alsologtostderr                            log to standard error as well as files (no effect when -logtostderr=true)
      --apiserver string                           The URL of the apiserver to use as a master
      --config string                              Path to the kube-state-metrics options config file
      --custom-resource-state-config string        Inline Custom Resource State Metrics config YAML (experimental)
      --custom-resource-state-config-file string   Path to a Custom Resource State Metrics config file (experimental)
      --custom-resource-state-only                 Only provide Custom Resource State metrics (experimental)
      --enable-gzip-encoding                       Gzip responses when requested by clients via 'Accept-Encoding: gzip' header.
  -h, --help                                       Print Help text
      --host string                                Host to expose metrics on. (default "::")
      --kubeconfig string                          Absolute path to the kubeconfig file
      --log_backtrace_at traceLocation             when logging hits line file:N, emit a stack trace (default :0)
      --log_dir string                             If non-empty, write log files in this directory (no effect when -logtostderr=true)
      --log_file string                            If non-empty, use this log file (no effect when -logtostderr=true)
      --log_file_max_size uint                     Defines the maximum size a log file can grow to (no effect when -logtostderr=true). Unit is megabytes. If the value is 0, the maximum file size is unlimited. (default 1800)
      --logtostderr                                log to standard error instead of files (default true)
      --metric-allowlist string                    Comma-separated list of metrics to be exposed. This list comprises of exact metric names and/or regex patterns. The allowlist and denylist are mutually exclusive.
      --metric-annotations-allowlist string        Comma-separated list of Kubernetes annotations keys that will be used in the resource' labels metric. By default the metric contains only name and namespace labels. To include additional annotations provide a list of resource names in their plural form and Kubernetes annotation keys you would like to allow for them (Example: '=namespaces=[kubernetes.io/team,...],pods=[kubernetes.io/team],...)'. A single '*' can be provided per resource instead to allow any annotations, but that has severe performance implications (Example: '=pods=[*]').
      --metric-denylist string                     Comma-separated list of metrics not to be enabled. This list comprises of exact metric names and/or regex patterns. The allowlist and denylist are mutually exclusive.
      --metric-labels-allowlist string             Comma-separated list of additional Kubernetes label keys that will be used in the resource' labels metric. By default the metric contains only name and namespace labels. To include additional labels provide a list of resource names in their plural form and Kubernetes label keys you would like to allow for them (Example: '=namespaces=[k8s-label-1,k8s-label-n,...],pods=[app],...)'. A single '*' can be provided per resource instead to allow any labels, but that has severe performance implications (Example: '=pods=[*]'). Additionally, an asterisk (*) can be provided as a key, which will resolve to all resources, i.e., assuming '--resources=deployments,pods', '=*=[*]' will resolve to '=deployments=[*],pods=[*]'.
      --metric-opt-in-list string                  Comma-separated list of metrics which are opt-in and not enabled by default. This is in addition to the metric allow- and denylists
      --namespaces string                          Comma-separated list of namespaces to be enabled. Defaults to ""
      --namespaces-denylist string                 Comma-separated list of namespaces not to be enabled. If namespaces and namespaces-denylist are both set, only namespaces that are excluded in namespaces-denylist will be used.
      --node string                                Name of the node that contains the kube-state-metrics pod. Most likely it should be passed via the downward API. This is used for daemonset sharding. Only available for resources (pod metrics) that support spec.nodeName fieldSelector. This is experimental.
      --one_output                                 If true, only write logs to their native severity level (vs also writing to each lower severity level; no effect when -logtostderr=true)
      --pod string                                 Name of the pod that contains the kube-state-metrics container. When set, it is expected that --pod and --pod-namespace are both set. Most likely this should be passed via the downward API. This is used for auto-detecting sharding. If set, this has preference over statically configured sharding. This is experimental, it may be removed without notice.
      --pod-namespace string                       Name of the namespace of the pod specified by --pod. When set, it is expected that --pod and --pod-namespace are both set. Most likely this should be passed via the downward API. This is used for auto-detecting sharding. If set, this has preference over statically configured sharding. This is experimental, it may be removed without notice.
      --port int                                   Port to expose metrics on. (default 8080)
      --resources string                           Comma-separated list of Resources to be enabled. Defaults to "certificatesigningrequests,configmaps,cronjobs,daemonsets,deployments,endpoints,horizontalpodautoscalers,ingresses,jobs,leases,limitranges,mutatingwebhookconfigurations,namespaces,networkpolicies,nodes,persistentvolumeclaims,persistentvolumes,poddisruptionbudgets,pods,replicasets,replicationcontrollers,resourcequotas,secrets,services,statefulsets,storageclasses,validatingwebhookconfigurations,volumeattachments"
      --shard int32                                The instances shard nominal (zero indexed) within the total number of shards. (default 0)
      --skip_headers                               If true, avoid header prefixes in the log messages
      --skip_log_headers                           If true, avoid headers when opening log files (no effect when -logtostderr=true)
      --stderrthreshold severity                   logs at or above this threshold go to stderr when writing to files and stderr (no effect when -logtostderr=true or -alsologtostderr=false) (default 2)
      --telemetry-host string                      Host to expose kube-state-metrics self metrics on. (default "::")
      --telemetry-port int                         Port to expose kube-state-metrics self metrics on. (default 8081)
      --tls-config string                          Path to the TLS configuration file
      --total-shards int                           The total number of shards. Sharding is disabled when total shards is set to 1. (default 1)
      --use-apiserver-cache                        Sets resourceVersinotallow=0 for ListWatch requests, using cached resources from the apiserver instead of an etcd quorum read.
  -v, --v Level                                    number for the log level verbosity
      --vmodule moduleSpec                         comma-separated list of pattern=N settings for file-filtered logging

Use "kube-state-metrics [command] --help" for more information about a command.- alert: KubeStateMetricsShardingMismatch
annotations:
description: kube-state-metrics pods are running with different --total-shards configuration, some Kubernetes objects may be exposed multiple times or not exposed at all.
summary: kube-state-metrics sharding is misconfigured.
expr: |
stdvar (kube_state_metrics_total_shards{job="kube-state-metrics"}) != 0
for: 15m
labels:
severity: critical
- alert: KubeStateMetricsShardsMissing
annotations:
description: kube-state-metrics shards are missing, some Kubernetes objects are not being exposed.
summary: kube-state-metrics shards are missing.
expr: |
2^max(kube_state_metrics_total_shards{job="kube-state-metrics"}) - 1
-
sum( 2 ^ max by (shard_ordinal) (kube_state_metrics_shard_ordinal{job="kube-state-metrics"}) )
!= 0
for: 15m
labels:
severity: criticalapiVersion: apps/v1
kind: StatefulSet
metadata:
name: kube-state-metrics
namespace: kube-system
spec:
replicas: 10
selector:
matchLabels:
app.kubernetes.io/name: kube-state-metrics
serviceName: kube-state-metrics
template:
metadata:
labels:
app.kubernetes.io/component: exporter
app.kubernetes.io/name: kube-state-metrics
app.kubernetes.io/version: 2.8.0
spec:
automountServiceAccountToken: true
containers:
- args:
- --pod=$(POD_NAME)
- --pod-namespace=$(POD_NAMESPACE)
env:
- name: POD_NAME
valueFrom:
fieldRef:
fieldPath: metadata.name
- name: POD_NAMESPACE
valueFrom:
fieldRef:
fieldPath: metadata.namespace
image: registry.k8s.io/kube-state-metrics/kube-state-metrics:v2.8.0
# ......$ kubectl apply -k examples/autosharding$ kubectl get pods -n kube-system -l app.kubernetes.io/name=kube-state-metrics
NAME READY STATUS RESTARTS AGE
kube-state-metrics-0 1/1 Running 0 70m
kube-state-metrics-1 1/1 Running 0 65m$ kubectl logs -f kube-state-metrics-1 -nkube-system
I0216 05:53:23.151163 1 wrapper.go:78] Starting kube-state-metrics
I0216 05:53:23.154495 1 server.go:125] "Used default resources"
I0216 05:53:23.154923 1 types.go:184] "Using all namespaces"
I0216 05:53:23.155556 1 server.go:166] "Metric allow-denylisting" allowDenyStatus="Excluding the following lists that were on denylist: "
W0216 05:53:23.155792 1 client_config.go:617] Neither --kubeconfig nor --master was specified. Using the inClusterConfig. This might not work.
I0216 05:53:23.178553 1 server.go:311] "Tested communication with server"
I0216 05:53:23.241024 1 server.go:316] "Run with Kubernetes cluster version" major="1" minor="25" gitVersinotallow="v1.25.3" gitTreeState="clean" gitCommit="434bfd82814af038ad94d62ebe59b133fcb50506" platform="linux/arm64"
I0216 05:53:23.241169 1 server.go:317] "Communication with server successful"
I0216 05:53:23.245132 1 server.go:263] "Started metrics server" metricsServerAddress="[::]:8080"
I0216 05:53:23.246148 1 metrics_handler.go:103] "Autosharding enabled with pod" pod="kube-system/kube-state-metrics-1"
I0216 05:53:23.246233 1 metrics_handler.go:104] "Auto detecting sharding settings"
I0216 05:53:23.246267 1 server.go:252] "Started kube-state-metrics self metrics server" telemetryAddress="[::]:8081"
I0216 05:53:23.253477 1 server.go:69] levelinfomsgListening onaddress[::]:8081
I0216 05:53:23.253477 1 server.go:69] levelinfomsgListening onaddress[::]:8080
I0216 05:53:23.253944 1 server.go:69] levelinfomsgTLS is disabled.http2falseaddress[::]:8080
I0216 05:53:23.254534 1 server.go:69] levelinfomsgTLS is disabled.http2falseaddress[::]:8081
I0216 05:53:23.297524 1 metrics_handler.go:80] "Configuring sharding of this instance to be shard index (zero-indexed) out of total shards" shard=1 totalShards=2
I0216 05:53:23.411710 1 builder.go:257] "Active resources" activeStoreNames="certificatesigningrequests,configmaps,cronjobs,daemonsets,deployments,endpoints,horizontalpodautoscalers,ingresses,jobs,leases,limitranges,mutatingwebhookconfigurations,namespaces,networkpolicies,nodes,persistentvolumeclaims,persistentvolumes,poddisruptionbudgets,pods,replicasets,replicationcontrollers,resourcequotas,secrets,services,statefulsets,storageclasses,validatingwebhookconfigurations,volumeattachments" 此外我们还可以单独针对 pod 指标按照每个节点进行分片,只需要加上 --node 和 --resource 即可,这个时候我们直接使用一个 DaemonSet 来创建 KSM 实例即可,如下所示:
apiVersion: apps/v1
kind: DaemonSet
spec:
  template:
    spec:
      containers:
      - image: registry.k8s.io/kube-state-metrics/kube-state-metrics:IMAGE_TAG
        name: kube-state-metrics
        args:
        - --resource=pods
        - --node=$(NODE_NAME)
        env:
        - name: NODE_NAME
          valueFrom:
            fieldRef:
              apiVersion: v1
fieldPath: spec.nodeName我正在尝试使用Capistrano部署带有puma的Rails应用程序。在部署结束时它尝试运行bundleexecpumactl-S/home/deployer/production/shared/sockets/puma.state重启失败了/undefinedmethod`has_key?'forfalse:FalseClass.我只是为puma.state创建了一个空文件。我的问题是这个文件到底是什么,里面应该有什么? 最佳答案 Puma有一个状态文件,记录了进程的PID。如果你是第一次部署,你应该删除.state文件,然后做
我希望Ruby的解析器会进行这种微不足道的优化,但似乎并没有(谈到YARV实现,Ruby1.9.x、2.0.0):require'benchmark'deffib1a,b=0,1whileb由于这两种方法除了在第二种方法中使用预定义常量而不是常量表达式外是相同的,因此Ruby解释器似乎在每个循环中一次又一次地计算幂常数。是否有一些Material说明为什么Ruby根本不进行这种基本优化或只在某些特定情况下进行? 最佳答案 很抱歉给出了另一个答案,但我不想删除或编辑我之前的答案,因为它下面有有趣的讨论。正如JörgWMittag所说,
我正在尝试从数据库中读取大量单元格(超过100.000个)并将它们写入VPSUbuntu服务器上的csv文件。碰巧服务器没有足够的内存。我正在考虑一次读取5000行并将它们写入文件,然后再读取5000行,等等。我应该如何重构我当前的代码以使内存不会被完全消耗?这是我的代码:defwrite_rows(emails)File.open(file_path,"w+")do|f|f该函数由sidekiqworker调用:write_rows(user.emails)感谢您的帮助! 最佳答案 这里的问题是,当您调用emails.each时,
我需要一个用于大型动态任务集合的调度程序。目前我正在查看resque-scheduler,rufus-scheduler,和clockwork.如果您提供有关选择使用哪一个(或其他替代方案)的建议,我将不胜感激。一些细节:有大量要定期执行的任务(最多100K)。最短执行周期为1h。新任务可能会不时出现。现有任务可能会更改或删除。调度延迟最小化在这里不是关键任务(可扩展性和可持续性最重要)。任务执行不是繁重的操作,可以轻松并行。总结,我需要类似cron的Ruby项目,它可以处理大量动态变化的任务集合。更新:我花了一天时间尝试调度库,现在我想简单总结一下新获得的经验。我已经不再关注Cloc
我正在使用state_machine构建一个多步骤表单,在过渡到下一步之前验证每个步骤的字段。这是我的模型:classFoo:step1doevent:nextdotransition:step1=>:step2transition:step2=>:step3endevent:previousdotransition:step3=>:step2transition:step2=>:step1endstate:step1dovalidates_presence_of:field1endstate:step2dovalidates_presence_of:field2endstate:st
文章目录前言约束硬约束的轨迹优化Corridor-BasedTrajectoryOptimizationBezierCurveOptimizationOtherOptions软约束的轨迹优化Distance-BasedTrajectoryOptimization优化方法前言可以看看我的这几篇Blog1,Blog2,Blog3。上次基于MinimumSnap的轨迹生成,有许多优点,比如:轨迹让机器人可以在某个时间点抵达某个航点。任何一个时刻,都能数学上求出期望的机器人的位置、速度、加速度、导数。MinimumSnap可以把问题转换为凸优化问题。缺点:MnimumSnap可以控制轨迹一定经过中间的
我对为我的RubyonRails3.1.3应用优化我的Unicorn设置的方法很感兴趣。我目前正在高CPU超大实例上生成14个工作进程,因为我的应用程序在负载测试期间似乎受CPU限制。在模拟负载测试中,每秒大约20个请求重放请求,我的实例上的所有8个内核都达到峰值,盒子负载飙升至7-8个。每个unicorn实例使用大约56-60%的CPU。我很好奇可以通过哪些方式对其进行优化?我希望能够每秒将更多请求汇集到这种大小的实例上。内存和所有其他I/O一样完全正常。在我的测试过程中,CPU越来越低。 最佳答案 如果您受CPU限制,您希望使用
美团外卖搜索工程团队在Elasticsearch的优化实践中,基于Location-BasedService(LBS)业务场景对Elasticsearch的查询性能进行优化。该优化基于Run-LengthEncoding(RLE)设计了一款高效的倒排索引结构,使检索耗时(TP99)降低了84%。本文从问题分析、技术选型、优化方案等方面进行阐述,并给出最终灰度验证的结论。1.前言最近十年,Elasticsearch已经成为了最受欢迎的开源检索引擎,其作为离线数仓、近线检索、B端检索的经典基建,已沉淀了大量的实践案例及优化总结。然而在高并发、高可用、大数据量的C端场景,目前可参考的资料并不多。因此
开门见山|拉取镜像dockerpullelasticsearch:7.16.1|配置存放的目录#存放配置文件的文件夹mkdir-p/opt/docker/elasticsearch/node-1/config#存放数据的文件夹mkdir-p/opt/docker/elasticsearch/node-1/data#存放运行日志的文件夹mkdir-p/opt/docker/elasticsearch/node-1/log#存放IK分词插件的文件夹mkdir-p/opt/docker/elasticsearch/node-1/plugins若你使用了moba,直接右键新建即可如上图所示依次类推创建
文章目录查看ES信息查看节点信息查看分片信息实际场景下ES分片及副本数量应该怎么分关于ES的灵活使用查看ES信息查看版本kibana:GET/查看节点信息GET/_cat/nodes?v解释:ip:集群中节点的ip地址;heap.percent:堆内存的占用百分比;ram.percent:总内存的占用百分比,其实这个不是很准确,因为buff/cache和available也被当作使用内存;cpu:cpu占用百分比;load_1m:1分钟内cpu负载;load_5m:5分钟内cpu负载;load_15m:15分钟内cpu负载;node.role:上图的dilmrt代表全部权限master:*代表