昨晚太晚代码还没有跑完,恰巧又遇到PSO-LSTM的准确率没办法复原,惨兮兮/(ㄒoㄒ)/,具体内容今天来补上
对人们对产品、服务、组织、个人、问题、事件、话题及其属性的观点、情 感、情绪、评价和态度的计算研究。文本情感分析(Sentiment Analysis)是自然语言处理(NLP)方法中常见的应用,也是一个有趣的基本任务,尤其是以提炼文本情绪内容为目的的分类。它是对带有情感色彩的主观性文本进行分析、处理、归纳和推理的过程。
本文将介绍情感分析中的情感极性(倾向)分析。所谓情感极性分析,指的是对文本进行褒义、贬义、中性的判断。在大多应用场景下,只分为两类。例如对于“喜爱”和“厌恶”这两个词,就属于不同的情感倾向。
本文将详细介绍如何进行文本数据预处理,并使用深度学习模型中的LSTM模型来实现文本的情感分析。
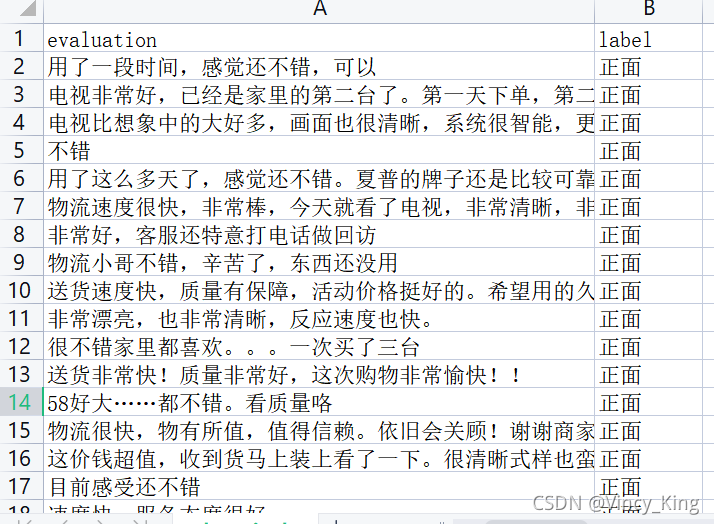
本项目以某电商网站中某个商品的评论作为语料(corpus.csv),点击下载数据集,该数据集一共有4310条评论数据,文本的情感分为两类:“正面”和“反面”,该数据集的前几行如下:
以下代码为统计数据集中的情感分布以及评论句子长度分布
import pandas as pd
import matplotlib.pyplot as plt
from matplotlib import font_manager
from itertools import accumulate

# 设置matplotlib绘图时的字体
my_font=font_manager.FontProperties(fname="C:\Windows\Fonts\simhei.ttf")

# 统计句子长度及长度出现的频数
df=pd.read_csv('data/data_single.csv')
print(df.groupby('label')['label'].count())

df['length']=df['evaluation'].apply(lambda x:len(x))
len_df=df.groupby('length').count()
sent_length=len_df.index.tolist()
sent_freq=len_df['evaluation'].tolist()

# 绘制句子长度及出现频数统计图
plt.bar(sent_length,sent_freq)
plt.title('句子长度及出现频数统计图',fontproperties=my_font)
plt.xlabel('句子长度',fontproperties=my_font)
plt.ylabel('句子长度出现的频数',fontproperties=my_font)
plt.show()
plt.close()
# 绘制句子长度累积分布函数(CDF)
sent_pentage_list=[(count/sum(sent_freq)) for count in accumulate(sent_freq)]

# 绘制CDF
plt.plot(sent_length,sent_pentage_list)

# 寻找分位点为quantile的句子长度
quantile=0.91
print(list(sent_pentage_list))
for length,per in zip(sent_length,sent_pentage_list):
    if round(per,2)==quantile:
        index=length
        break
print('\n分位点维%s的句子长度:%d.'%(quantile,index))

plt.show()
plt.close()

# 绘制句子长度累积分布函数图
plt.plot(sent_length,sent_pentage_list)
plt.hlines(quantile,0,index,colors='c',linestyles='dashed')
plt.vlines(index,0,quantile,colors='c',linestyles='dashed')
plt.text(0,quantile,str(quantile))
plt.text(index,0,str(index))
plt.title('句子长度累计分布函数图',fontproperties=my_font)
plt.xlabel('句子长度',fontproperties=my_font)
plt.ylabel('句子长度累积频率',fontproperties=my_font)
plt.show()
plt.close()
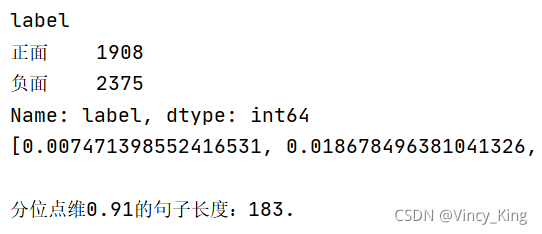
输出结果如下:
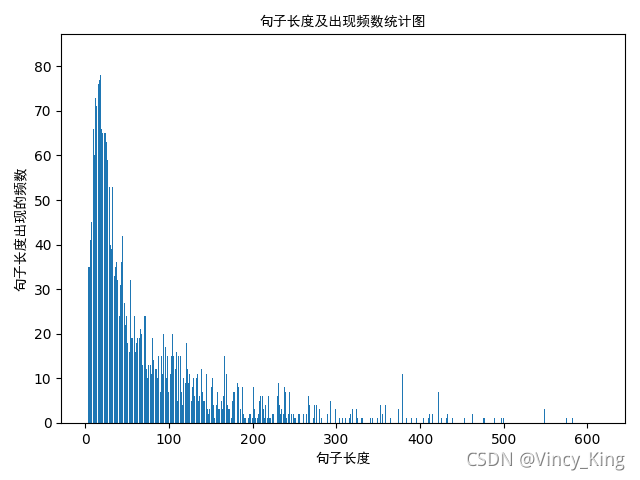
句子长度及出现频数统计图如下:
句子长度累积分布函数图如下:

从以上的图片可以看出,大多数样本的句子长度集中在1-200之间,句子长度累计频率取0.91分位点,则长度为183左右。
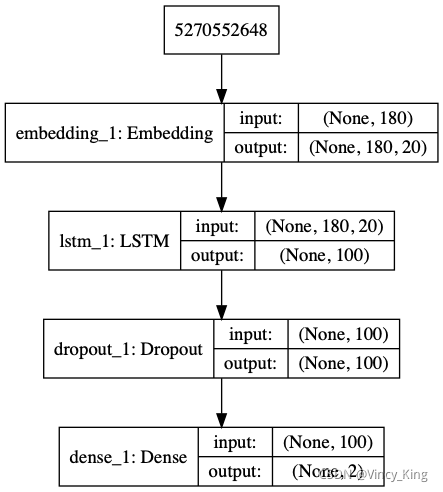
实现的模型框架如下:
代码如下:
import pickle
import numpy as np
import pandas as pd
from keras.utils import np_utils
from keras.utils.vis_utils import plot_model
from keras.models import Sequential
from keras.preprocessing.sequence import pad_sequences
from keras.layers import LSTM, Dense, Embedding,Dropout
from sklearn.model_selection import train_test_split
from sklearn.metrics import accuracy_score

# load dataset
# ['evaluation'] is feature, ['label'] is label
def load_data(filepath,input_shape=20):
    df=pd.read_csv(filepath)

    # 标签及词汇表
    labels,vocabulary=list(df['label'].unique()),list(df['evaluation'].unique())

    # 构造字符级别的特征
    string=''
    for word in vocabulary:
        string+=word

    vocabulary=set(string)

    # 字典列表
    word_dictionary={word:i+1 for i,word in enumerate(vocabulary)}
    with open('word_dict.pk','wb') as f:
        pickle.dump(word_dictionary,f)
    inverse_word_dictionary={i+1:word for i,word in enumerate(vocabulary)}
    label_dictionary={label:i for i,label in enumerate(labels)}
    with open('label_dict.pk','wb') as f:
        pickle.dump(label_dictionary,f)
    output_dictionary={i:labels for i,labels in enumerate(labels)}

    # 词汇表大小
    vocab_size=len(word_dictionary.keys())
    # 标签类别数量
    label_size=len(label_dictionary.keys())

    # 序列填充,按input_shape填充,长度不足的按0补充
    x=[[word_dictionary[word] for word in sent] for sent in df['evaluation']]
    x=pad_sequences(maxlen=input_shape,sequences=x,padding='post',value=0)
    y=[[label_dictionary[sent]] for sent in df['label']]
    '''
    np_utils.to_categorical用于将标签转化为形如(nb_samples, nb_classes)
    的二值序列。
    假设num_classes = 10。
    如将[1, 2, 3,……4]转化成:
    [[0, 1, 0, 0, 0, 0, 0, 0]
     [0, 0, 1, 0, 0, 0, 0, 0]
     [0, 0, 0, 1, 0, 0, 0, 0]
    ……
    [0, 0, 0, 0, 1, 0, 0, 0]]
    '''
    y=[np_utils.to_categorical(label,num_classes=label_size) for label in y]
    y=np.array([list(_[0]) for _ in y])

    return x,y,output_dictionary,vocab_size,label_size,inverse_word_dictionary

# 创建深度学习模型,Embedding + LSTM + Softmax
def create_LSTM(n_units,input_shape,output_dim,filepath):
    x,y,output_dictionary,vocab_size,label_size,inverse_word_dictionary=load_data(filepath)
    model=Sequential()
    model.add(Embedding(input_dim=vocab_size+1,output_dim=output_dim,
                        input_length=input_shape,mask_zero=True))
    model.add(LSTM(n_units,input_shape=(x.shape[0],x.shape[1])))
    model.add(Dropout(0.2))
    model.add(Dense(label_size,activation='softmax'))
    model.compile(loss='categorical_crossentropy',optimizer='adam',metrics=['accuracy'])

    '''
        error:ImportError: ('You must install pydot (`pip install pydot`) and install graphviz (see instructions at https://graphviz.gitlab.io/download/) ', 'for plot_model/model_to_dot to work.')
        版本问题:from keras.utils.vis_utils import plot_model
        真正解决方案:https://www.pianshen.com/article/6746984081/
    '''

    plot_model(model,to_file='./model_lstm.png',show_shapes=True)
    # 输出模型信息
    model.summary()

    return model

# 模型训练
def model_train(input_shape,filepath,model_save_path):
    # 将数据集分为训练集和测试集,占比为9:1
    # input_shape=100
    x,y,output_dictionary,vocab_size,label_size,inverse_word_dictionary=load_data(filepath,input_shape)
    train_x,test_x,train_y,test_y=train_test_split(x,y,test_size=0.1,random_state=42)

    # 模型输入参数,需要根据自己需要调整
    n_units=100
    batch_size=32
    epochs=5
    output_dim=20

    # 模型训练
    lstm_model=create_LSTM(n_units,input_shape,output_dim,filepath)
    lstm_model.fit(train_x,train_y,epochs=epochs,batch_size=batch_size,verbose=1)

    # 模型保存
    lstm_model.save(model_save_path)

    # 测试条数
    N= test_x.shape[0]
    predict=[]
    label=[]
    for start,end in zip(range(0,N,1),range(1,N+1,1)):
        print(f'start:{start}, end:{end}')
        sentence=[inverse_word_dictionary[i] for i in test_x[start] if i!=0]
        y_predict=lstm_model.predict(test_x[start:end])
        print('y_predict:',y_predict)
        label_predict=output_dictionary[np.argmax(y_predict[0])]
        label_true=output_dictionary[np.argmax(test_y[start:end])]
        print(f'label_predict:{label_predict}, label_true:{label_true}')
        # 输出预测结果
        print(''.join(sentence),label_true,label_predict)
        predict.append(label_predict)
        label.append(label_true)

    # 预测准确率
    acc=accuracy_score(predict,label)
    print('模型在测试集上的准确率:%s'%acc)

if __name__=='__main__':
    filepath='data/data_single.csv'
    input_shape=180
    model_save_path='data/corpus_model.h5'
    model_train(input_shape,filepath,model_save_path)
如果代码中输入from keras.utils import plot_model报错的话,可以改成from keras.utils.vis_utils import plot_model。
而我改了之后仍然报错:error:ImportError: ('You must install pydot (pip install pydot) and install graphviz (see instructions at https://graphviz.gitlab.io/download/) ', ‘for plot_model/model_to_dot to work.’)
以下为解决方案:


np_utils.to_categorical用于将标签转化为形如(nb_samples, nb_classes)
的二值序列。
假设num_classes = 10。
如将[1, 2, 3,……4]转化成:
[[0, 1, 0, 0, 0, 0, 0, 0]
[0, 0, 1, 0, 0, 0, 0, 0]
[0, 0, 0, 1, 0, 0, 0, 0]
……
[0, 0, 0, 0, 1, 0, 0, 0]]
通过model.summary()输出模型各层的参数状况,如图所示:

此文章参考了农夫三拳有點疼 博客和错误解决参考链接
我想将html转换为纯文本。不过,我不想只删除标签,我想智能地保留尽可能多的格式。为插入换行符标签,检测段落并格式化它们等。输入非常简单,通常是格式良好的html(不是整个文档,只是一堆内容,通常没有anchor或图像)。我可以将几个正则表达式放在一起,让我达到80%,但我认为可能有一些现有的解决方案更智能。 最佳答案 首先,不要尝试为此使用正则表达式。很有可能你会想出一个脆弱/脆弱的解决方案,它会随着HTML的变化而崩溃,或者很难管理和维护。您可以使用Nokogiri快速解析HTML并提取文本:require'nokogiri'h
我有这个代码:context"Visitingtheusers#indexpage."dobefore(:each){visitusers_path}subject{page}pending('iii'){shouldhave_no_css('table#users')}pending{shouldhavecontent('Youhavereachedthispageduetoapermissionic错误')}它会导致几个待处理,例如ManagingUsersGivenapractitionerloggedin.Visitingtheusers#indexpage.#Noreason
我一直在玩一个脚本,它在Chrome中获取选定的文本并在Google中查找它,提供四个最佳选择,然后粘贴相关链接。它以不同的格式粘贴,具体取决于当前在Chrome中打开的页面-DokuWiki打开的DokuWiki格式,普通网站的HTML,我想要我的WordPress所见即所得编辑器的富文本。我尝试使用pbpaste-Preferrtf来查看没有其他样式的富文本链接在粘贴板上的样子,但它仍然输出纯文本。在文本编辑中保存文件并进行试验后,我想出了以下内容text=%q|{\rtf1{\field{\*\fldinst{HYPERLINK"URL"}}{\fldrsltTEXT}}}|te
我使用“newapp_name”创建了一个新的Rails应用程序,我正在尝试编辑.gitignore文件,但在我的应用程序文件夹中找不到它。我在哪里可以找到它?我安装了Git。 最佳答案 .gitignore位于项目的root中,而不是app子目录中。首先打开终端并进入您的目录。您需要使用ls-a来显示stash文件。然后使用打开.gitignore 关于ruby-on-rails-尝试打开.gitignore以在文本编辑器中对其进行编辑,但在OSXMountainLion上找不到文件位
我想获取任意的ASCII文本字符串,例如“Helloworld”,并将其压缩为字符数较少(尽可能少)的版本,但要采用可以解压缩的方式。压缩版本应仅由ascii字符组成。有没有一种方法可以做到这一点,尤其是在Ruby中? 最佳答案 如果知道只会使用ASCII字符,那就是每个字节的低7位。通过位操作,您可以将每8个字节混合成7个字节(节省12.5%)。如果您可以将其放入更小的范围(仅限64个有效字符),则可以删除另一个字节。但是,因为您希望压缩形式也只包含ASCII字符,所以会丢失一个字节-除非您的输入可以限制为64个字符(例如,有损压
多年来,我在各种网站上遇到过各种问题,用户在字符串和文本字段的开头/结尾放置空格。有时这些会导致格式/布局问题,有时会导致搜索问题(即搜索顺序看起来不对,但实际上并非如此),有时它们实际上会使应用程序崩溃。我认为这会很有用,而不是像我过去所做的那样放入一堆before_save回调,向ActiveRecord添加一些功能以在保存之前自动调用任何字符串/文本字段上的.strip,除非我告诉它不是,例如do_not_strip:field_x,:field_y或类定义顶部的类似内容。在我去弄清楚如何做到这一点之前,有没有人看到更好的解决方案?明确一点,我已经知道我可以做到这一点:befor
我正在尝试使用nokogirigem提取页面上的所有url及其链接文本,并将链接文本和url存储在散列中。FooBar我想回去{"Foo"=>"#foo","Bar"=>"#bar"} 最佳答案 这是一个单行:Hash[doc.xpath('//a[@href]').map{|link|[link.text.strip,link["href"]]}]#=>{"Foo"=>"#foo","Bar"=>"#bar"}拆分一点可以说更具可读性:h={}doc.xpath('//a[@href]').eachdo|link|h[link.t
目录0专栏介绍1平面2R机器人概述2运动学建模2.1正运动学模型2.2逆运动学模型2.3机器人运动学仿真3动力学建模3.1计算动能3.2势能计算与动力学方程3.3动力学仿真0专栏介绍?附C++/Python/Matlab全套代码?课程设计、毕业设计、创新竞赛必备!详细介绍全局规划(图搜索、采样法、智能算法等);局部规划(DWA、APF等);曲线优化(贝塞尔曲线、B样条曲线等)。?详情:图解自动驾驶中的运动规划(MotionPlanning),附几十种规划算法1平面2R机器人概述如图1所示为本文的研究本体——平面2R机器人。对参数进行如下定义:机器人广义坐标
网站的日志分析,是seo优化不可忽视的一门功课,但网站越大,每天产生的日志就越大,大站一天都可以产生几个G的网站日志,如果光靠肉眼去分析,那可能看到猴年马月都看不完,因此借助网站日志分析工具去分析网站日志,那将会使网站日志分析工作变得更简单。下面推荐两款网站日志分析软件。第一款:逆火网站日志分析器逆火网站日志分析器是一款功能全面的网站服务器日志分析软件。通过分析网站的日志文件,不仅能够精准的知道网站的访问量、网站的访问来源,网站的广告点击,访客的地区统计,搜索引擎关键字查询等,还能够一次性分析多个网站的日志文件,让你轻松管理网站。逆火网站日志分析器下载地址:https://pan.baidu.
一、机器人介绍 此处是基于MATLABRVC工具箱,对ABB-IRB-1200型号的微型机械臂进行正逆向运动学分析,并利Simulink工具实现对机械臂进行具有动力学参数的末端轨迹规划仿真,最后根据机械模型设计Simulink-Adams联合仿真。 图1.ABBIRB 1200尺寸参数示意图ABBIRB 1200提供的两种型号广泛适用于各作业,且两者间零部件通用,两种型号的工作范围分别为700 mm 和 900 mm,大有效负载分别为 7 kg 和5 kg。 IRB 1200 能够在狭小空间内能发挥其工作范围与性能优势,具有全新的设计、小型化的体积、高效的性能、易于集成、便捷的接