wget https://dl.grafana.com/enterprise/release/grafana-enterprise-9.3.2-1.x86_64.rpm
sudo yum install grafana-enterprise-9.3.2-1.x86_64.rpm -ysudo systemctl daemon-reload
sudo systemctl start grafana-server
# Grafana 开机自启动
sudo systemctl enable grafana-server
sudo systemctl status grafana-server
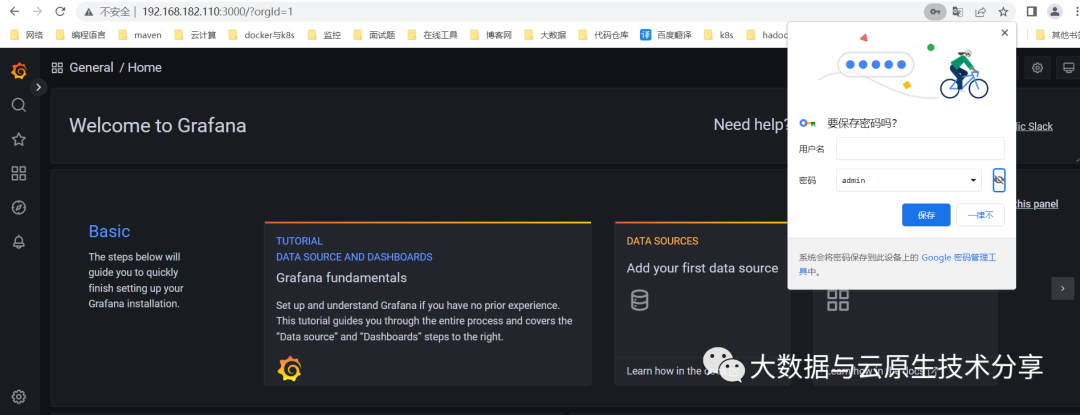
# 默认端口 3000
netstat -nlpt|grep 3000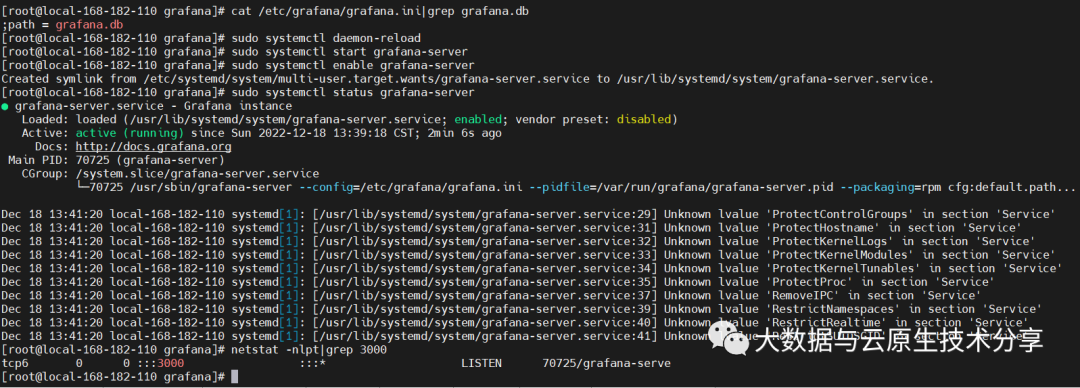
# 登录客户端
mysql -uroot -p
密码:123456

# 创建数据库
CREATE DATABASE IF NOT EXISTS grafana default charset utf8 COLLATE utf8_general_ci;

# 创建用户并授权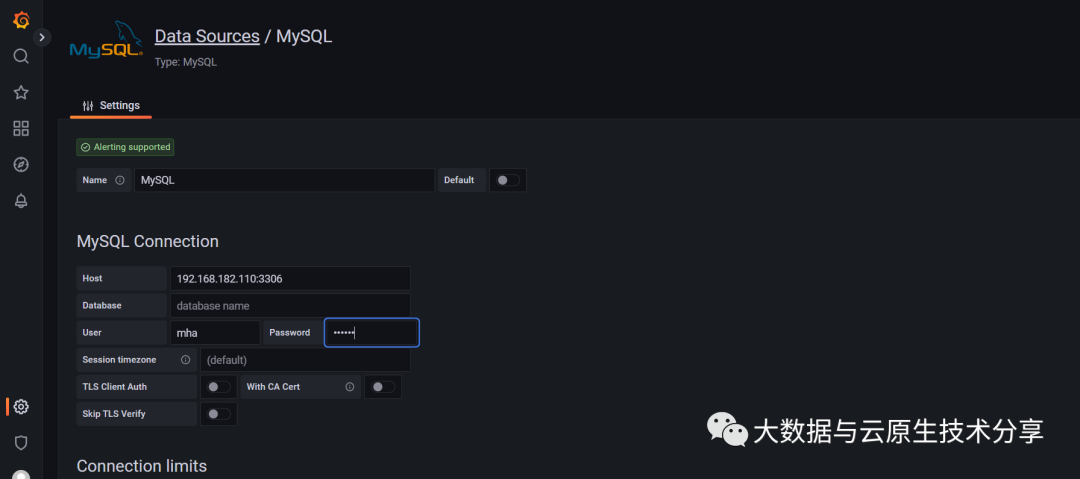
grant all on grafana.* to 'grafana'@'192.168.182.%' identified by '123456';[database]
type = mysql
host = 192.168.182.110:3306
name = grafana
user = grafana
password = 123456
# 也可以直接配置url
# url = mysql://grafana:grafana@192.168.182.110:3306/grafanasystemctl restart grafana-server
wget https://github.com/prometheus/node_exporter/releases/download/v1.5.0/node_exporter-1.5.0.linux-amd64.tar.gz
tar -xzf node_exporter-1.5.0.linux-amd64.tar.gz# 默认端口9100
cat >/usr/lib/systemd/system/node_exporter.service<<EOF
[Unit]
Descriptinotallow=node_exporter
After=network.target
#可以创建相应的用户和组 启动
#User=prometheus
#Group=prometheus
[Service]
ExecStart=/opt/prometheus/exporter/node_exporter/node_exporter-1.5.0.linux-amd64/node_exporter --web.listen-address=:9100
[Install]
WantedBy=multi-user.target
EOFsystemctl daemon-reload
systemctl start node_exporter
systemctl status node_exporter
systemctl enable node_exportercurl http://localhost:9100/metrics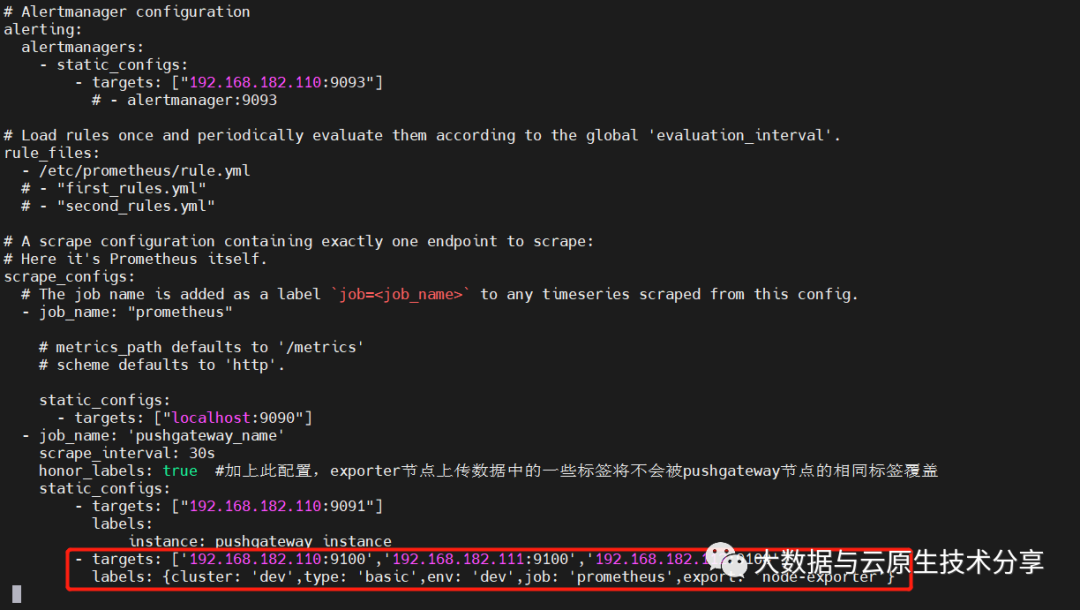 重新加载
重新加载systemctl restart prometheus
# 1、 kill方式
#kill -HUP pid
# 2、curl方式(推荐)
#curl -X POST http://IP/-/reload
# 【注意】需要在启动的命令行增加参数:--web.enable-lifecycle
curl -X POST http://192.168.182.110:9090/-/reload
# 3、重启(不推荐,重启会导致所有的连接短暂性中断)
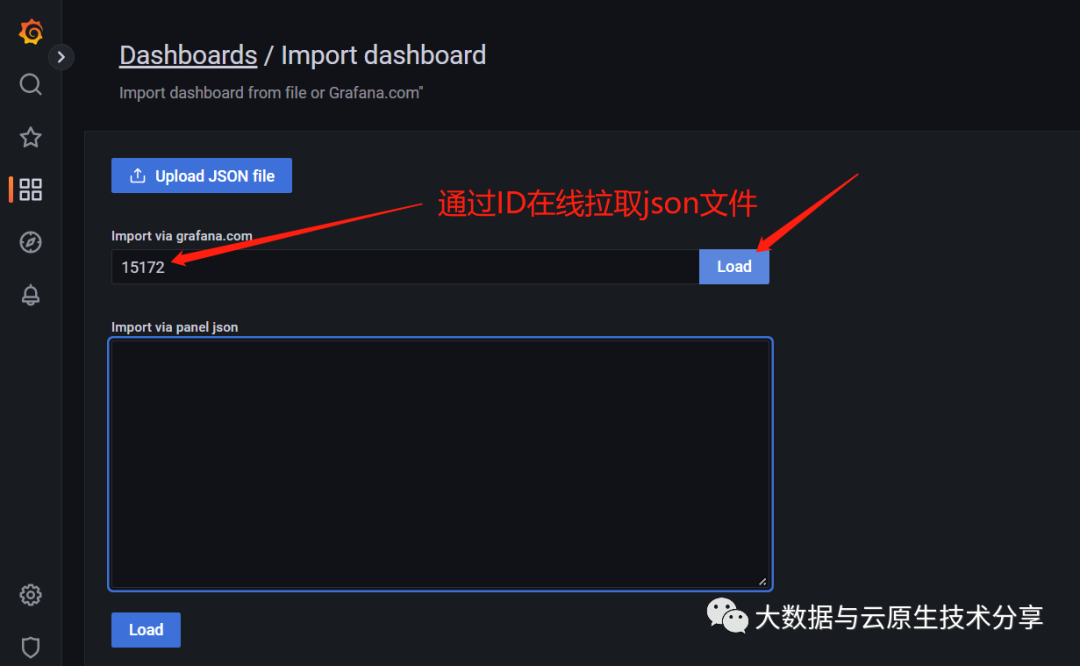
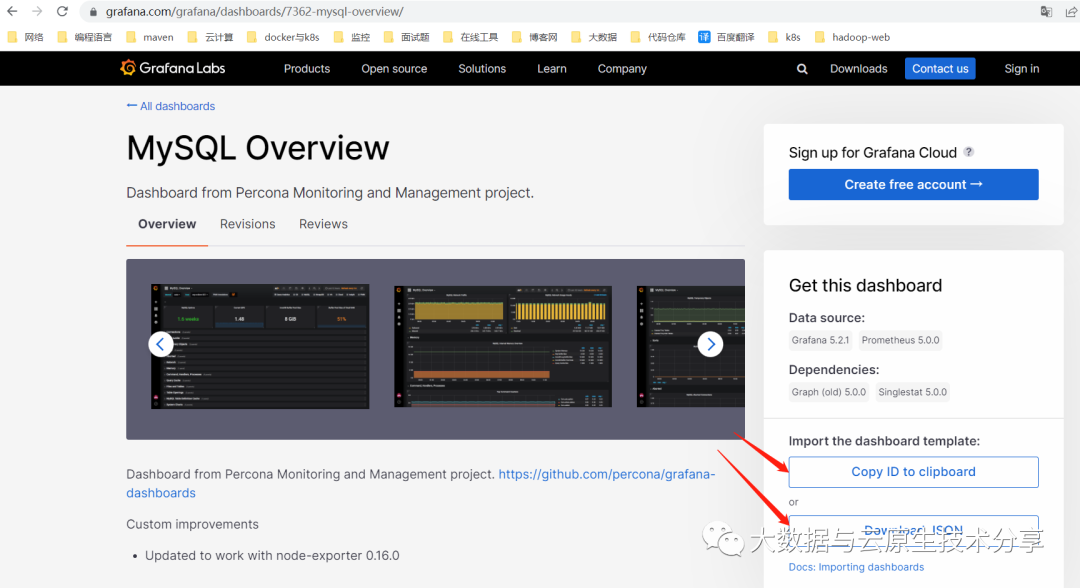
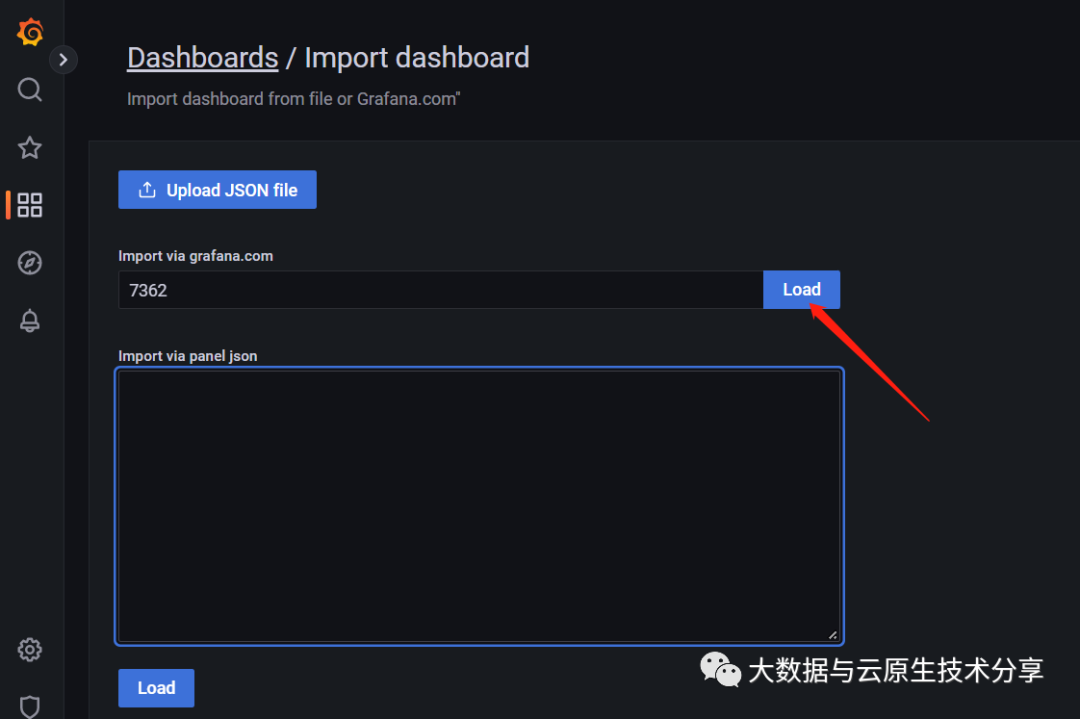
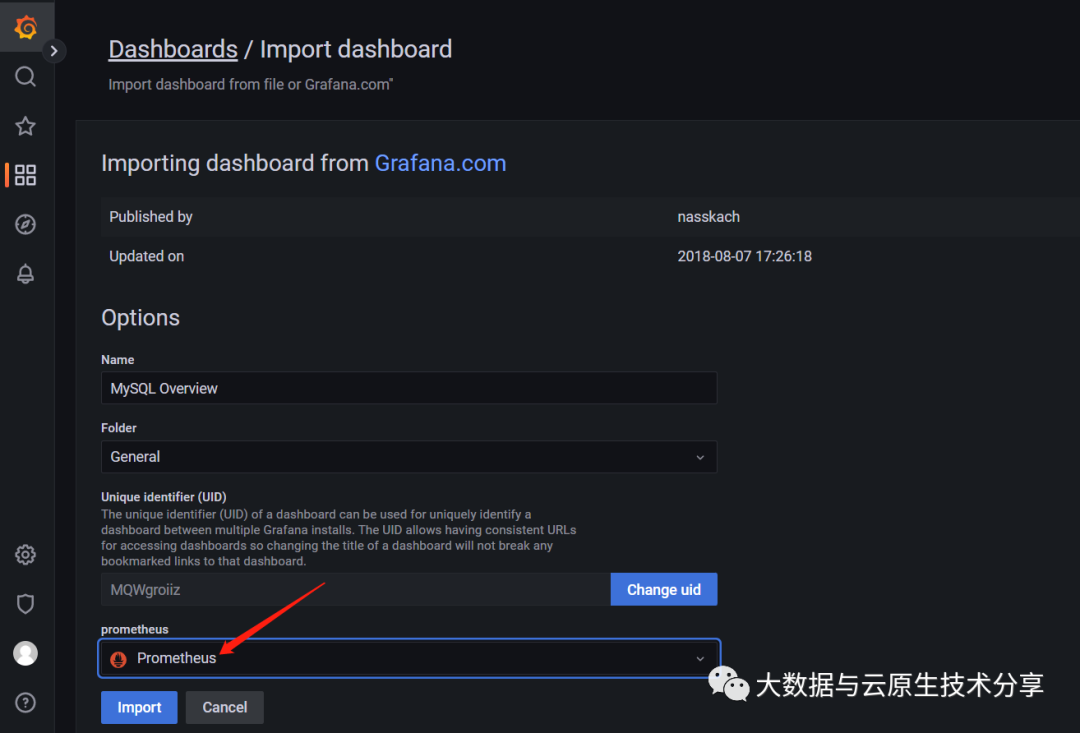
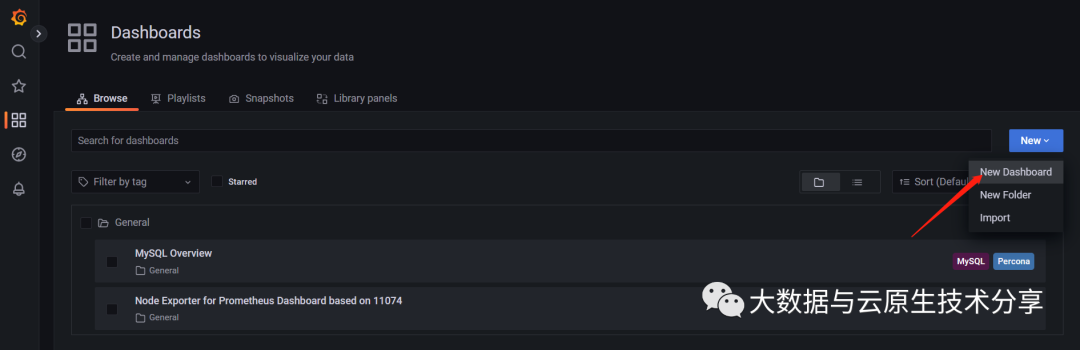
# systemctl restart prometheus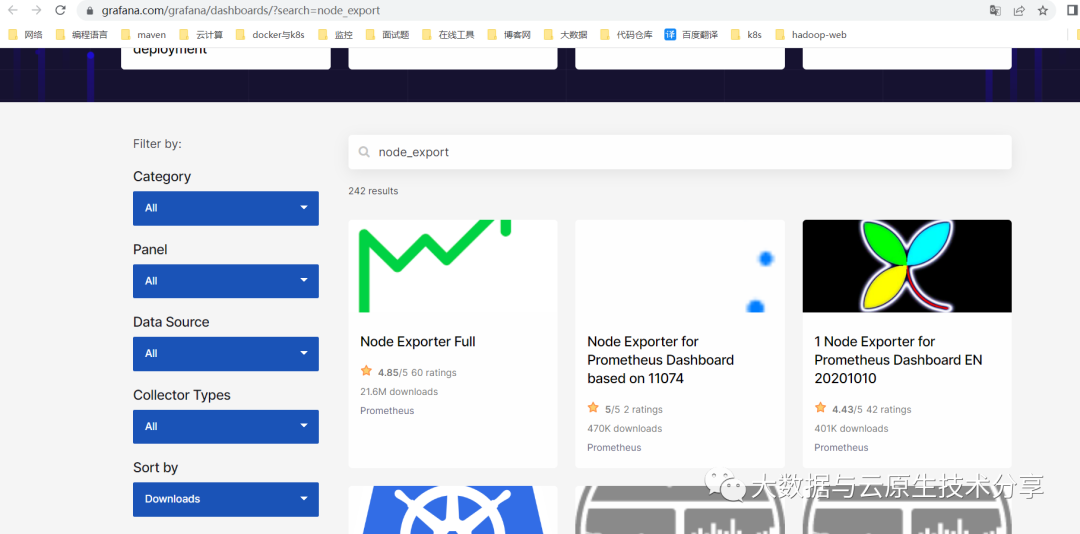 加载有两种方式:离线(json文件)和在线(通过ID远程下载json)
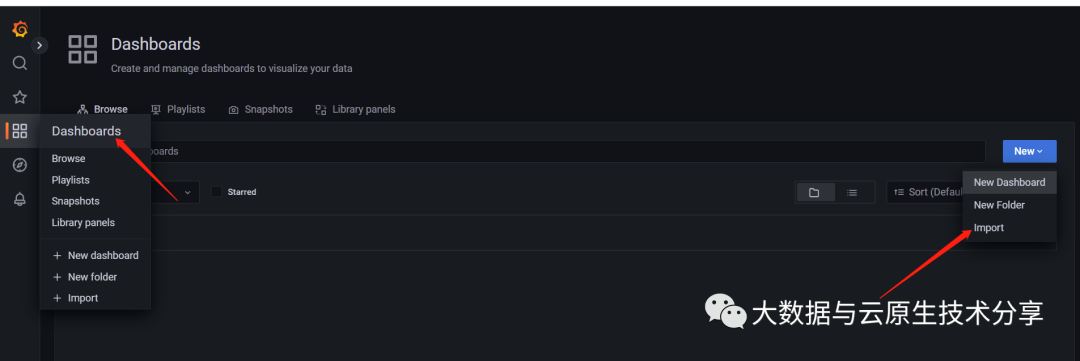
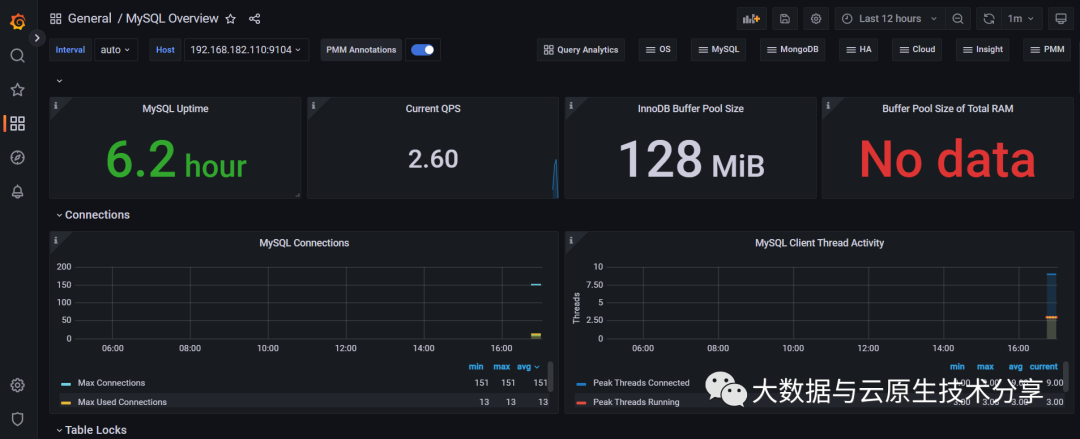
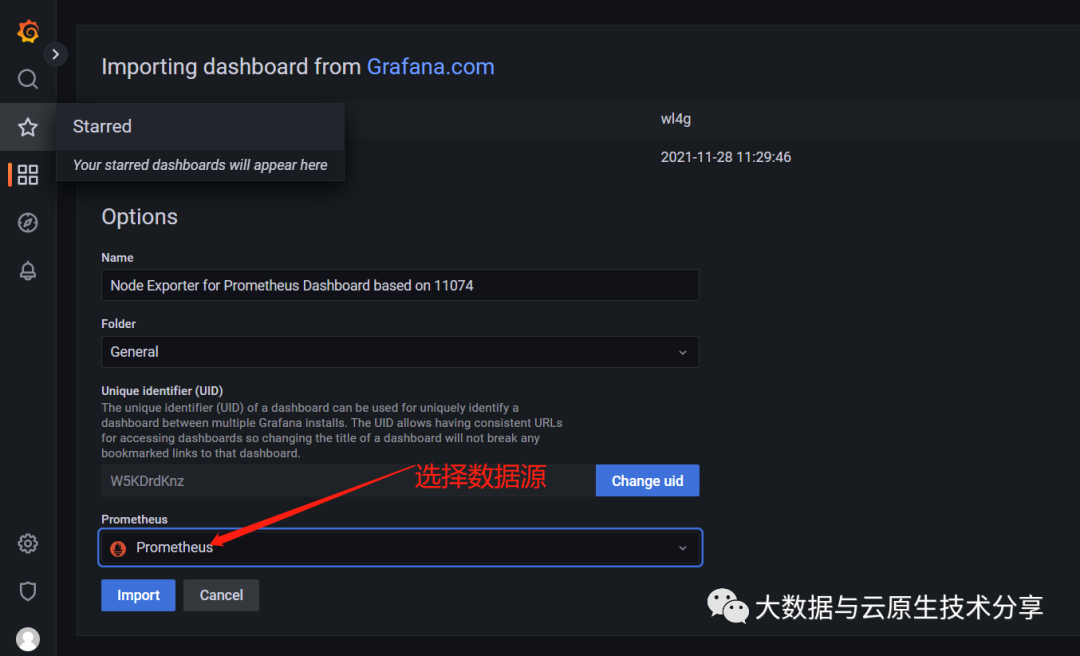 导入之后就可以看到数据了。
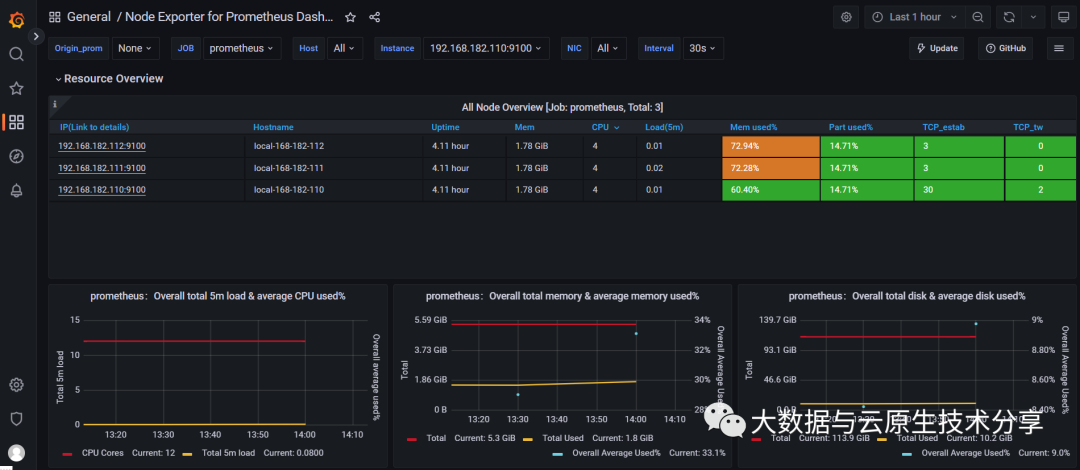
# 注意MySQL对应的版本
export VER=0.12.0
wget https://github.com/prometheus/mysqld_exporter/releases/download/v${VER}/mysqld_exporter-${VER}.linux-amd64.tar.gz
tar xvf mysqld_exporter-${VER}.linux-amd64.tar.gz
mv mysqld_exporter-${VER}.linux-amd64/mysqld_exporter /usr/local/bin/
chmod +x /usr/local/bin/mysqld_exportercat > /root/.my.cnf <<EOF
[client]
host=192.168.182.110
port=3306
user=mha
password=123456
EOF# 默认端口:9104
cat > /etc/systemd/system/mysqld_exporter.service <<EOF
[Unit]
Descriptinotallow=Prometheus MySQL Exporter
After=network.target
#User=prometheus
#Group=prometheus
[Service]
Type=simple
Restart=always
ExecStart=/usr/local/bin/mysqld_exporter \
--config.my-cnf /root/.my.cnf \
--collect.global_status \
--collect.info_schema.innodb_metrics \
--collect.auto_increment.columns \
--collect.info_schema.processlist \
--collect.binlog_size \
--collect.info_schema.tablestats \
--collect.global_variables \
--collect.info_schema.query_response_time \
--collect.info_schema.userstats \
--collect.info_schema.tables \
--collect.perf_schema.tablelocks \
--collect.perf_schema.file_events \
--collect.perf_schema.eventswaits \
--collect.perf_schema.indexiowaits \
--collect.perf_schema.tableiowaits \
--collect.slave_status \
--web.listen-address=0.0.0.0:9104
[Install]
WantedBy=multi-user.target
EOFsystemctl daemon-reload
systemctl start mysqld_exporter
systemctl status mysqld_exporter
systemctl enable mysqld_exporter
# 启动并开机自启,等价于上面两行
# systemctl enable --now mysqld_exporter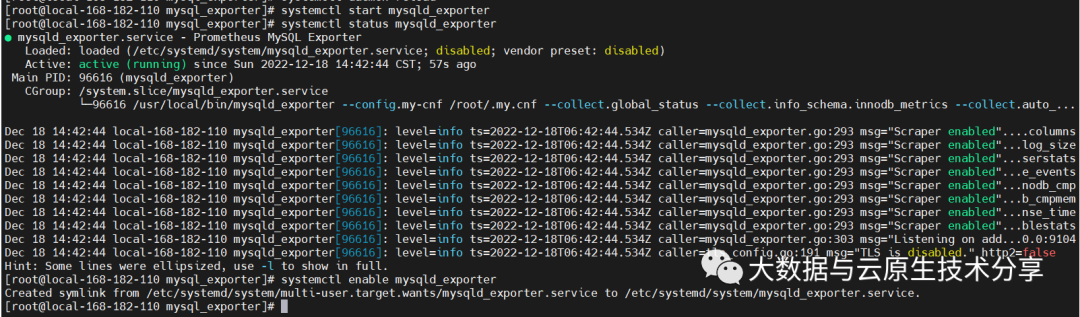 【5】检查
【5】检查curl http://localhost:9104/metrics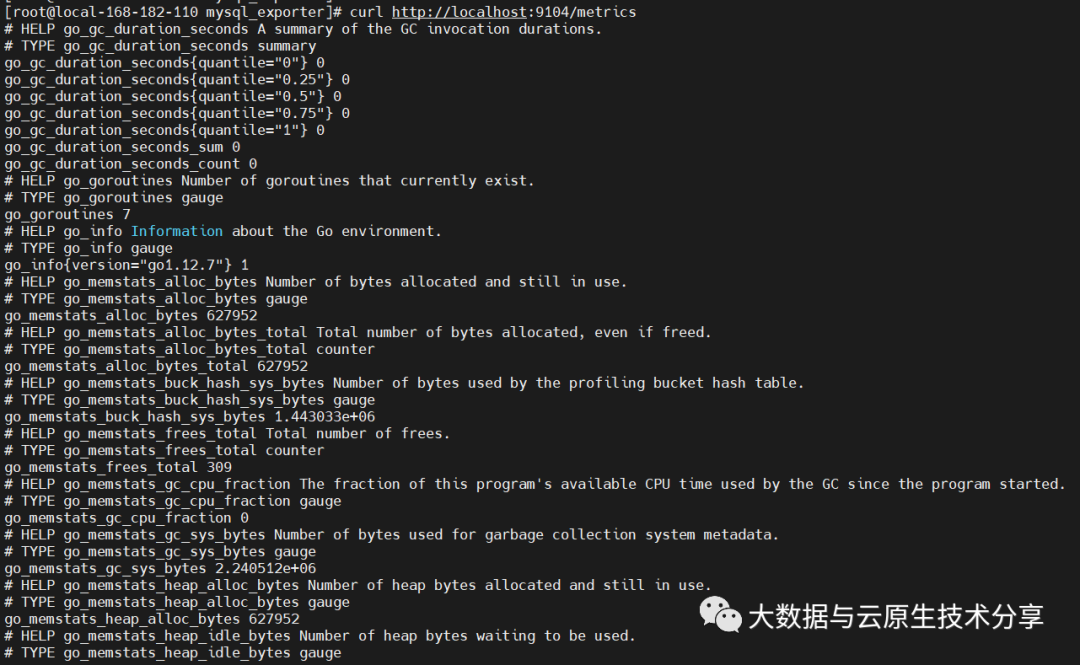
 重新加载
重新加载systemctl restart prometheus
# 1、 kill方式
#kill -HUP pid
# 2、curl方式(推荐)
#curl -X POST http://IP/-/reload
# 【注意】需要在启动的命令行增加参数:--web.enable-lifecycle
curl -X POST http://192.168.182.110:9090/-/reload
# 3、重启(不推荐,重启会导致所有的连接短暂性中断)
# systemctl restart prometheus
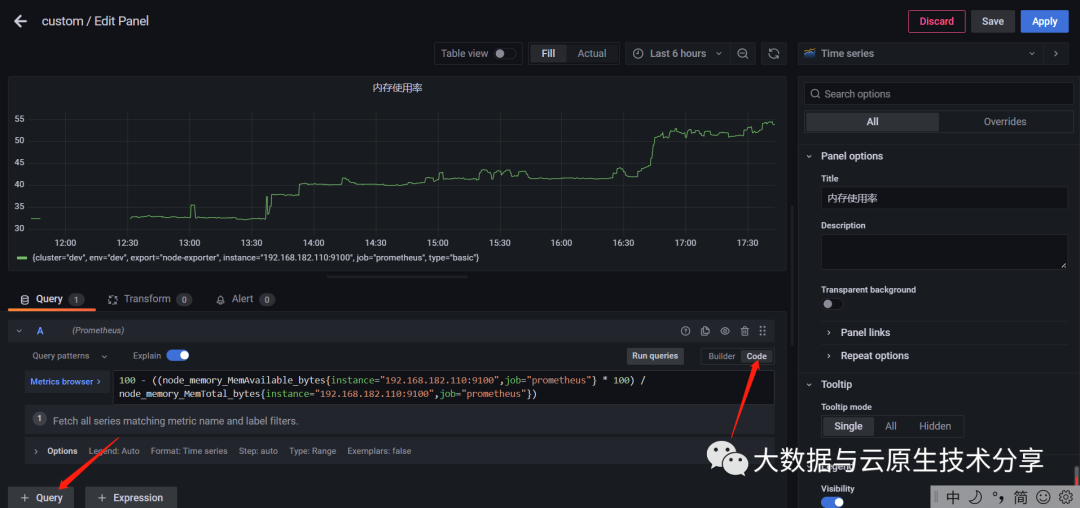
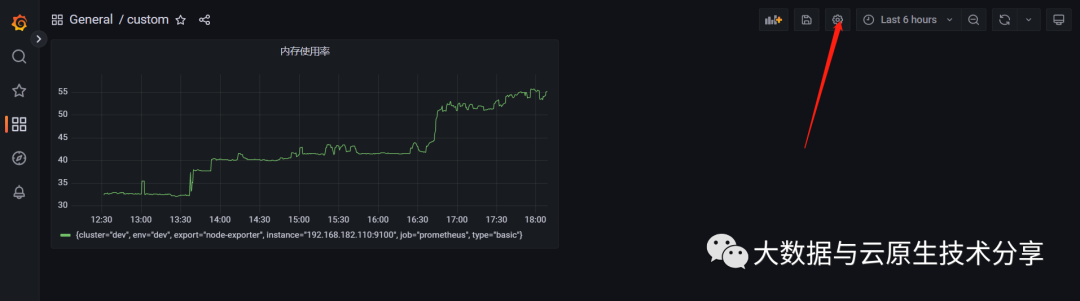
# 内存使用率
100 - ((node_memory_MemAvailable_bytes{instance="192.168.182.110:9100",job="prometheus"} * 100) / node_memory_MemTotal_bytes{instance="192.168.182.110:9100",job="prometheus"})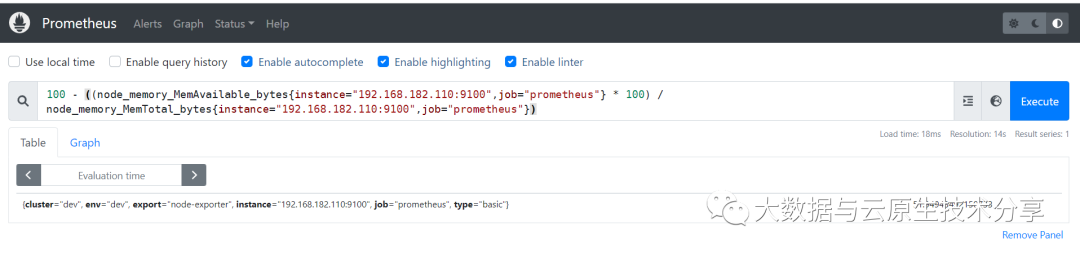
 上面只显示一个机器的内存,显然还不完善,如果想显示多个,可以这样表达:
# 把instance="192.168.182.110:9100"去掉
100 - ((node_memory_MemAvailable_bytes{job="prometheus"} * 100) / node_memory_MemTotal_bytes{job="prometheus"})

# 或者复制几份
100 - ((node_memory_MemAvailable_bytes{instance="192.168.182.110:9100",job="prometheus"} * 100) / node_memory_MemTotal_bytes{instance="192.168.182.110:9100",job="prometheus"})
100 - ((node_memory_MemAvailable_bytes{instance="192.168.182.111:9100",job="prometheus"} * 100) / node_memory_MemTotal_bytes{instance="192.168.182.111:9100",job="prometheus"})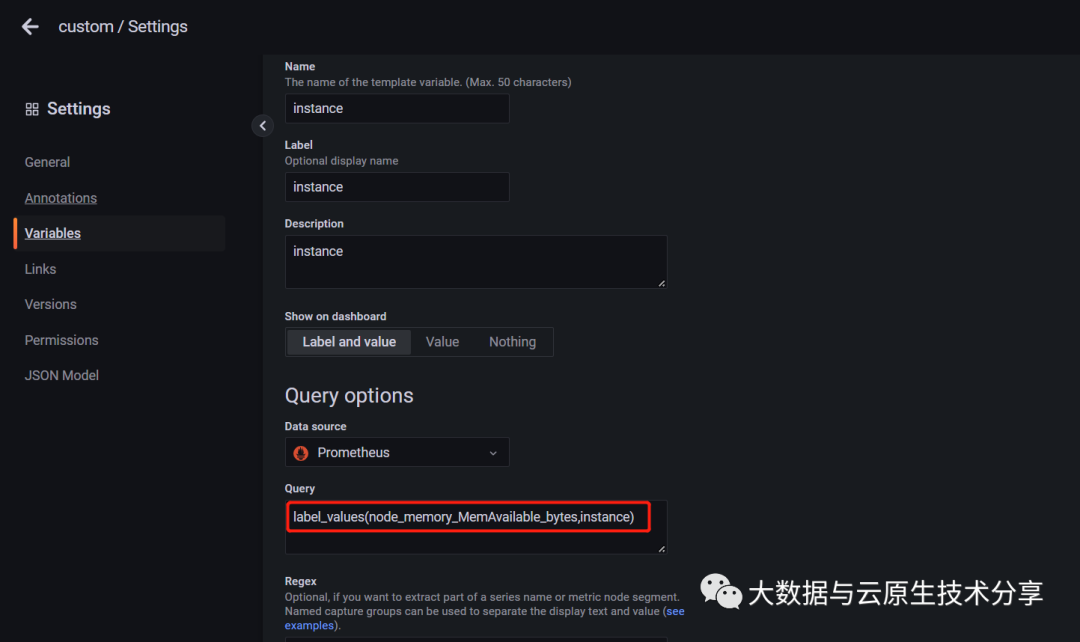
100 - ((node_memory_MemAvailable_bytes{instance="192.168.182.112:9100",job="prometheus"} * 100) / node_memory_MemTotal_bytes{instance="192.168.182.112:9100",job="prometheus"})| 函数 | 作用 |
| label_values(label) | 返回Promthues所有监控指标中,标签名为label的所有可选值。 |
| label_values(metric, label) | 返回Promthues所有监控指标metric中,标签名为label的所有可选值。 |
| metrics(metric) | 返回所有指标名称满足metric定义正则表达式的指标名称 |
| query_result(query) | 返回prometheus查询语句的查询结果 |
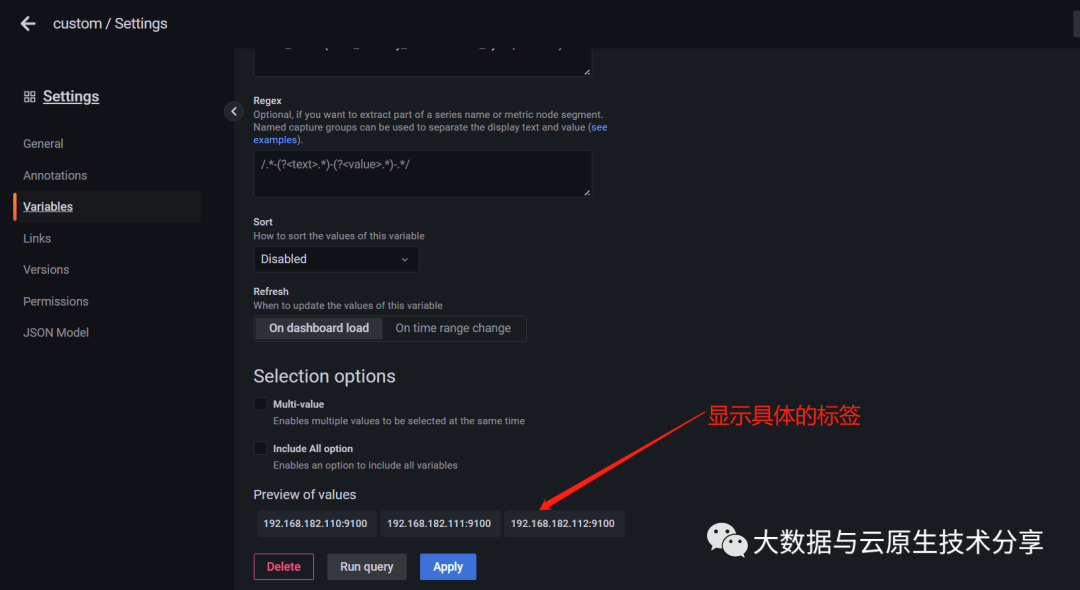
【温馨提示】虽然选择组合值可以在一个panel里面查看多种监控数据,但是由于不同监控数据的数值大小格式都可能不一样,在一个图形里面格式很难兼容,这样就会出现问题,所以此处建议默认都不选。
 修改表达如下:
100 - ((node_memory_MemAvailable_bytes{instance="$instance",job="prometheus"} * 100) / node_memory_MemTotal_bytes{instance="$instance",job="prometheus"})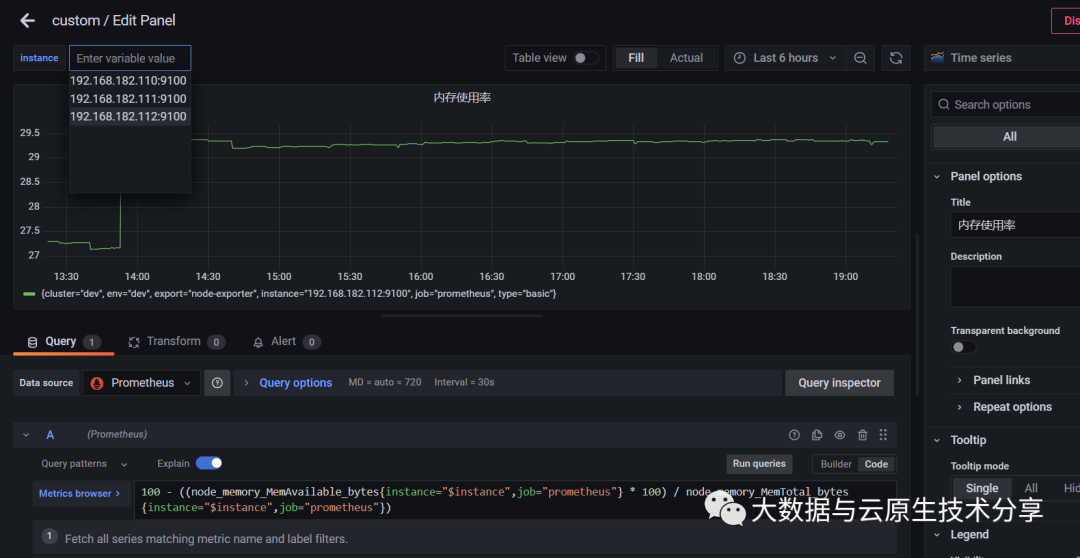
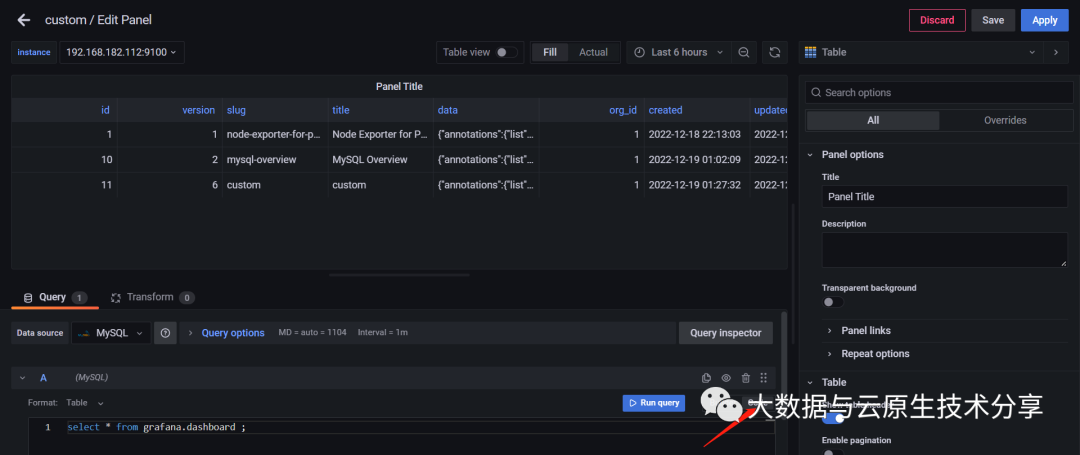 可以直接写sql,直接以表格的形式展现,非常的方便的,像在大数据领域sql是使用最频繁的,所以使用这种直接sql的方式显示图表监控情况还是非常方便的。
 ?博客主页:https://xiaoy.blog.csdn.net?本文由呆呆敲代码的小Y原创,首发于CSDN??学习专栏推荐:Unity系统学习专栏?游戏制作专栏推荐:游戏制作?Unity实战100例专栏推荐:Unity实战100例教程?欢迎点赞?收藏⭐留言?如有错误敬请指正!?未来很长,值得我们全力奔赴更美好的生活✨------------------❤️分割线❤️-------------------------
@作者:SYFStrive @博客首页:HomePage📜:微信小程序📌:个人社区(欢迎大佬们加入)👉:社区链接🔗📌:觉得文章不错可以点点关注👉:专栏连接🔗💃:感谢支持,学累了可以先看小段由小胖给大家带来的街舞👉微信小程序(🔥)目录自定义组件-behaviors 1、什么是behaviors 2、behaviors的工作方式 3、创建behavior 4、导入并使用behavior 5、behavior中所有可用的节点 6、同名字段的覆盖和组合规则总结最后自定义组件-behaviors 1、什么是behaviorsbehaviors是小程序中,用于实现
我有一个使用SeleniumWebdriver和Nokogiri的Ruby应用程序。我想选择一个类,然后对于那个类对应的每个div,我想根据div的内容执行一个Action。例如,我正在解析以下页面:https://www.google.com/webhp?sourceid=chrome-instant&ion=1&espv=2&ie=UTF-8#q=puppies这是一个搜索结果页面,我正在寻找描述中包含“Adoption”一词的第一个结果。因此机器人应该寻找带有className:"result"的div,对于每个检查它的.descriptiondiv是否包含单词“adoption
我正在我的Rails项目中安装Grape以构建RESTfulAPI。现在一些端点的操作需要身份验证,而另一些则不需要身份验证。例如,我有users端点,看起来像这样:moduleBackendmoduleV1classUsers现在如您所见,除了password/forget之外的所有操作都需要用户登录/验证。创建一个新的端点也没有意义,比如passwords并且只是删除password/forget从逻辑上讲,这个端点应该与用户资源。问题是Grapebefore过滤器没有像except,only这样的选项,我可以在其中说对某些操作应用过滤器。您通常如何干净利落地处理这种情况?
在我做的一些网络开发中,我有多个操作开始,比如对外部API的GET请求,我希望它们同时开始,因为一个不依赖另一个的结果。我希望事情能够在后台运行。我找到了concurrent-rubylibrary这似乎运作良好。通过将其混合到您创建的类中,该类的方法具有在后台线程上运行的异步版本。这导致我编写如下代码,其中FirstAsyncWorker和SecondAsyncWorker是我编写的类,我在其中混合了Concurrent::Async模块,并编写了一个名为“work”的方法来发送HTTP请求:defindexop1_result=FirstAsyncWorker.new.async.
a=[3,4,7,8,3]b=[5,3,6,8,3]假设数组长度相同,是否有办法使用each或其他一些惯用方法从两个数组的每个元素中获取结果?不使用计数器?例如获取每个元素的乘积:[15,12,42,64,9](0..a.count-1).eachdo|i|太丑了...ruby1.9.3 最佳答案 使用Array.zip怎么样?:>>a=[3,4,7,8,3]=>[3,4,7,8,3]>>b=[5,3,6,8,3]=>[5,3,6,8,3]>>c=[]=>[]>>a.zip(b)do|i,j|c[[3,5],[4,3],[7,6],
我有一个非常简单的Controller来管理我的Rails应用程序中的静态页面:classPagesController我怎样才能让View模板返回它自己的名字,这样我就可以做这样的事情:#pricing.html.erb#-->"Pricing"感谢您的帮助。 最佳答案 4.3RoutingParametersTheparamshashwillalwayscontainthe:controllerand:actionkeys,butyoushouldusethemethodscontroller_nameandaction_nam
1、接口请求基本操作1.1例子tips在view的选项可以zoomin调整窗口字帖大小。1、创建一个测试的workspace,并命名为test2、test后面新增一个addrequest3、选择发送GET,URL为一个开源的https://api.apiopen.top/api/sentences获取每日一句4、点击send查看内容Tips:如果提示出现Error:tunnelingsocketcouldnotbeestablished,statusCode=407错误,参照以下解决办法)关于tunnelingsocketcouldnotbeestablished,cause=getaddri
Linux操作系统——网络配置与SSH远程安装完VMware与系统后,需要进行网络配置。第一个目标为进行SSH连接,可以从本机到VMware进行文件传送,首先需要进行网络配置。1.下载远程软件首先需要先下载安装一款远程软件:FinalShell或者xhell7FinalShellxhell7FinalShell下载:Windows下载http://www.hostbuf.com/downloads/finalshell_install.exemacOS下载http://www.hostbuf.com/downloads/finalshell_install.pkg2.配置CentOS网络安装好
目录SpringBootStarter是什么?以前传统的做法使用SpringBootStarter之后starter的理念:starter的实现: 创建SpringBootStarter步骤在idea新建一个starter项目、直接执行下一步即可生成项目。 在xml中加入如下配置文件:创建proterties类来保存配置信息创建业务类:创建AutoConfiguration测试如下:SpringBootStarter是什么? SpringBootStarter是在SpringBoot组件中被提出来的一种概念、简化了很多烦琐的配置、通过引入各种SpringBootStarter包可以快速搭建出一