前段时间写的特殊热图绘制函数迎来大更新,基础使用教程可以看看这一篇:
https://slandarer.blog.csdn.net/article/details/129292679


原本的绘图代码几乎完全不变,主要是增添了很多新的功能!!!
工具函数完整代码放在最后,但还是建议大家直接去fileexchange或者gitee下载,因为还包含一些素材包(主要是slanCM包),当然也可以单独去下载slanCM包不过麻烦些:
https://gitee.com/slandarer/matlab-special-heatmap
https://gitee.com/slandarer/slanColor
此部分所使用数据:
% 随便捏造了点数据(Made up some data casually)
X=randn(20,15)+[(linspace(-1,2.5,20)').*ones(1,6),(linspace(.5,-.7,20)').*ones(1,5),(linspace(.9,-.2,20)').*ones(1,4)];
% 求相关系数矩阵(Get the correlation matrix)
Data=corr(X);
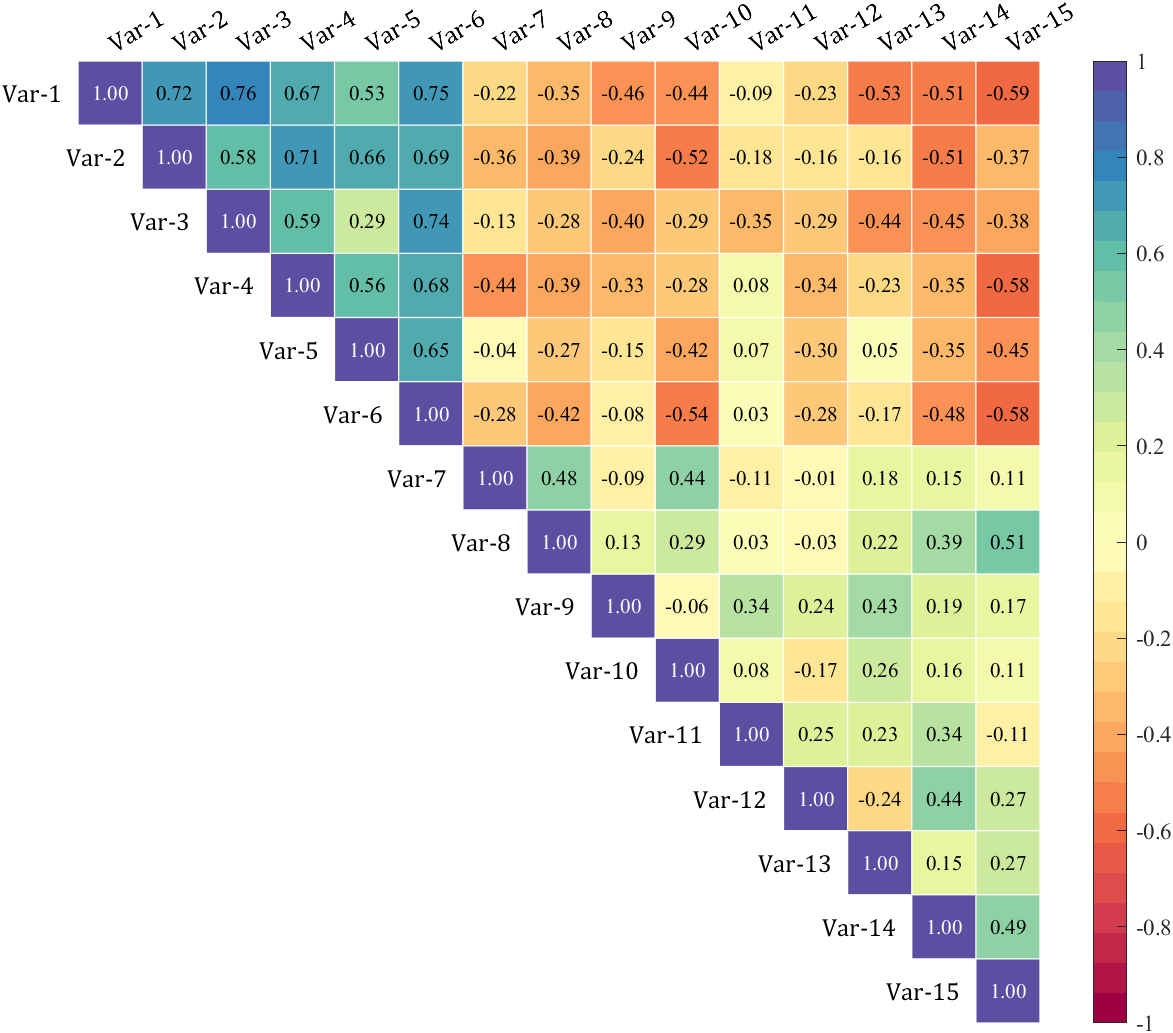
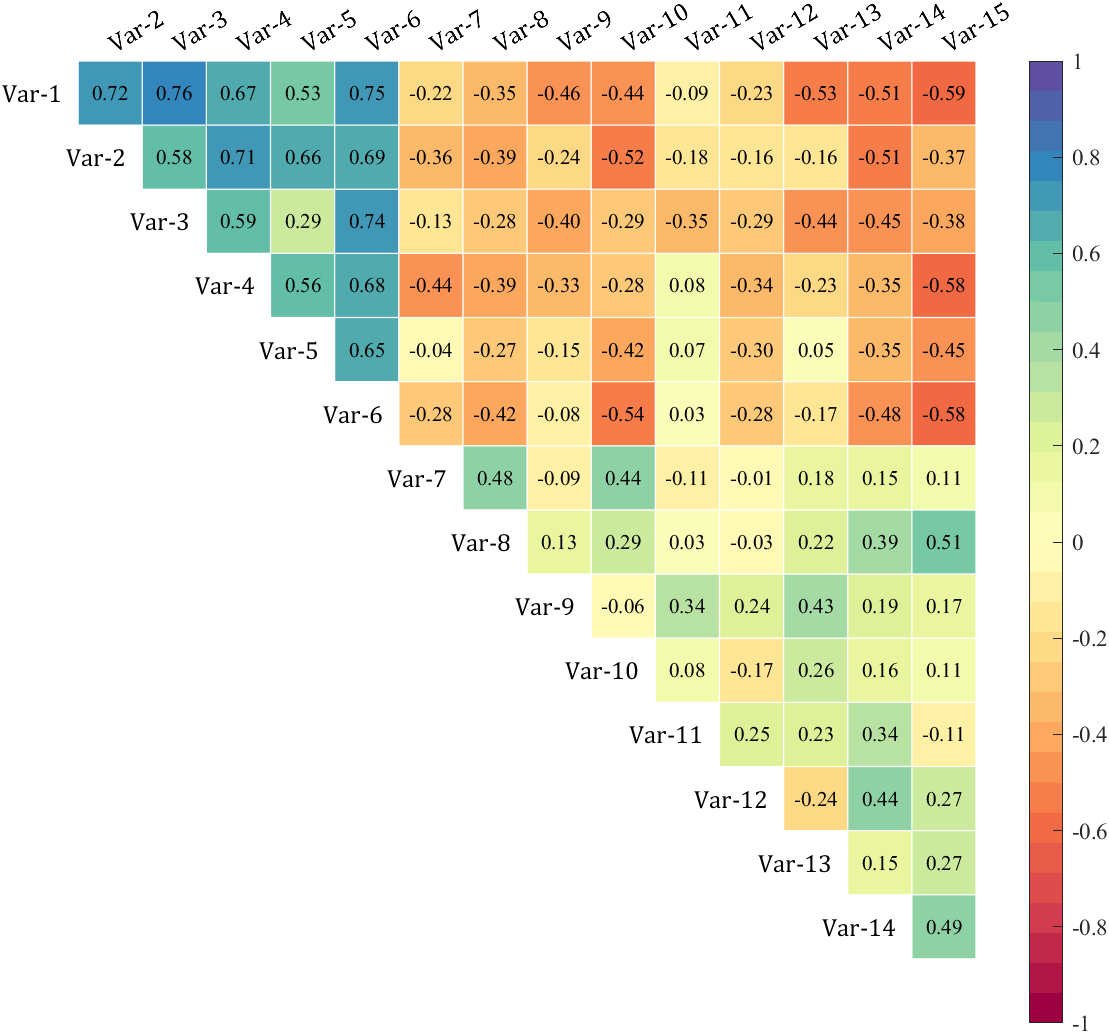
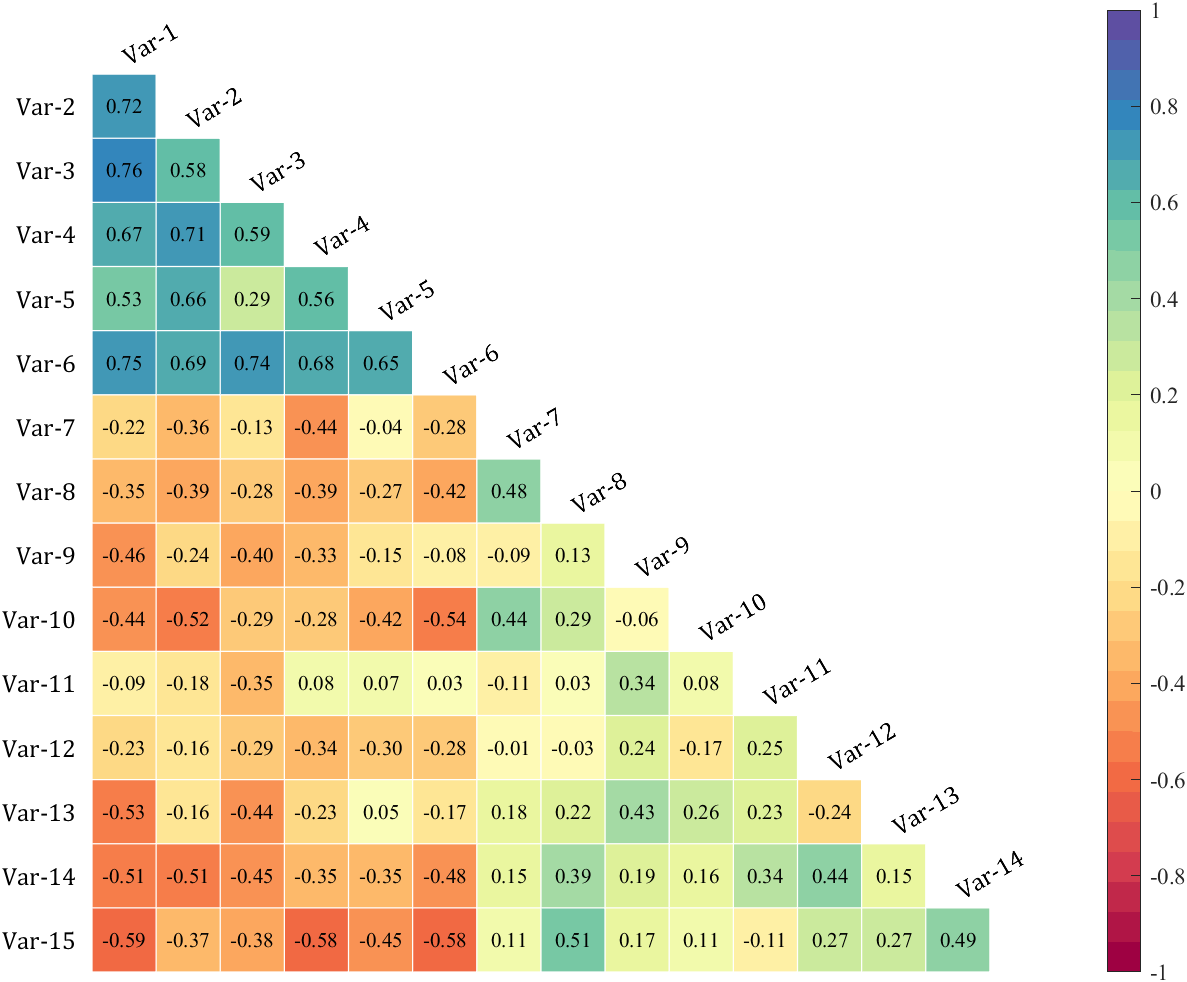
通过 setType() 函数设置三角化格式,可设置为:
% + 'triu'   : upper triangle                  : 上三角部分
% + 'tril'   : lower triangle                  : 下三角部分
% + 'triu0'  : upper triangle without diagonal : 扣除对角线上三角部分
% + 'tril0'  : lower triangle without diagonal : 扣除对角线下三角部分

Type={'triu','tril','triu0','tril0'};
for i=1:length(Type)
    figure()
    SHM_s1=SHeatmap(Data,'Format','sq');
    SHM_s1=SHM_s1.draw();
    SHM_s1.setText();
    % 设置格式(set Type)
    SHM_s1.setType(Type{i})
%     exportgraphics(gca,['gallery\Type_',Type{i},'.png'])
end

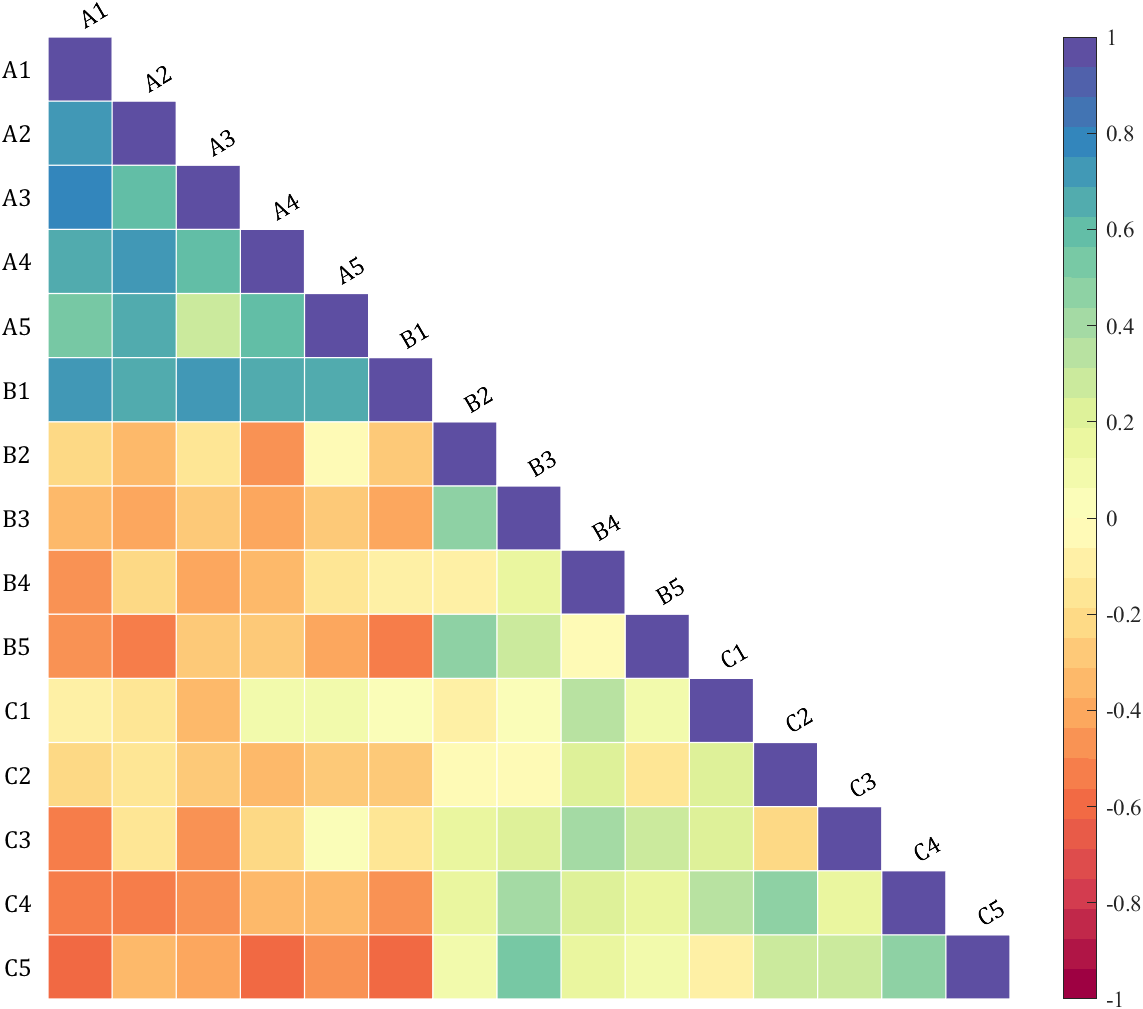
figure()
SHM_s2=SHeatmap(Data,'Format','sq');
SHM_s2=SHM_s2.draw();
SHM_s2.setType('tril');

varName={'A1','A2','A3','A4','A5','B1','B2','B3','B4','B5','C1','C2','C3','C4','C5'};
SHM_s2.setVarName(varName)
figure()
SHM_s5=SHeatmap(Data,'Format','circ');
SHM_s5=SHM_s5.draw();
SHM_s5.setType('triu');
% 设置标签颜色(Set Font Color)
SHM_s5.setRowLabel('Color',[.8,0,0])
SHM_s5.setColLabel('Color',[0,0,.8])

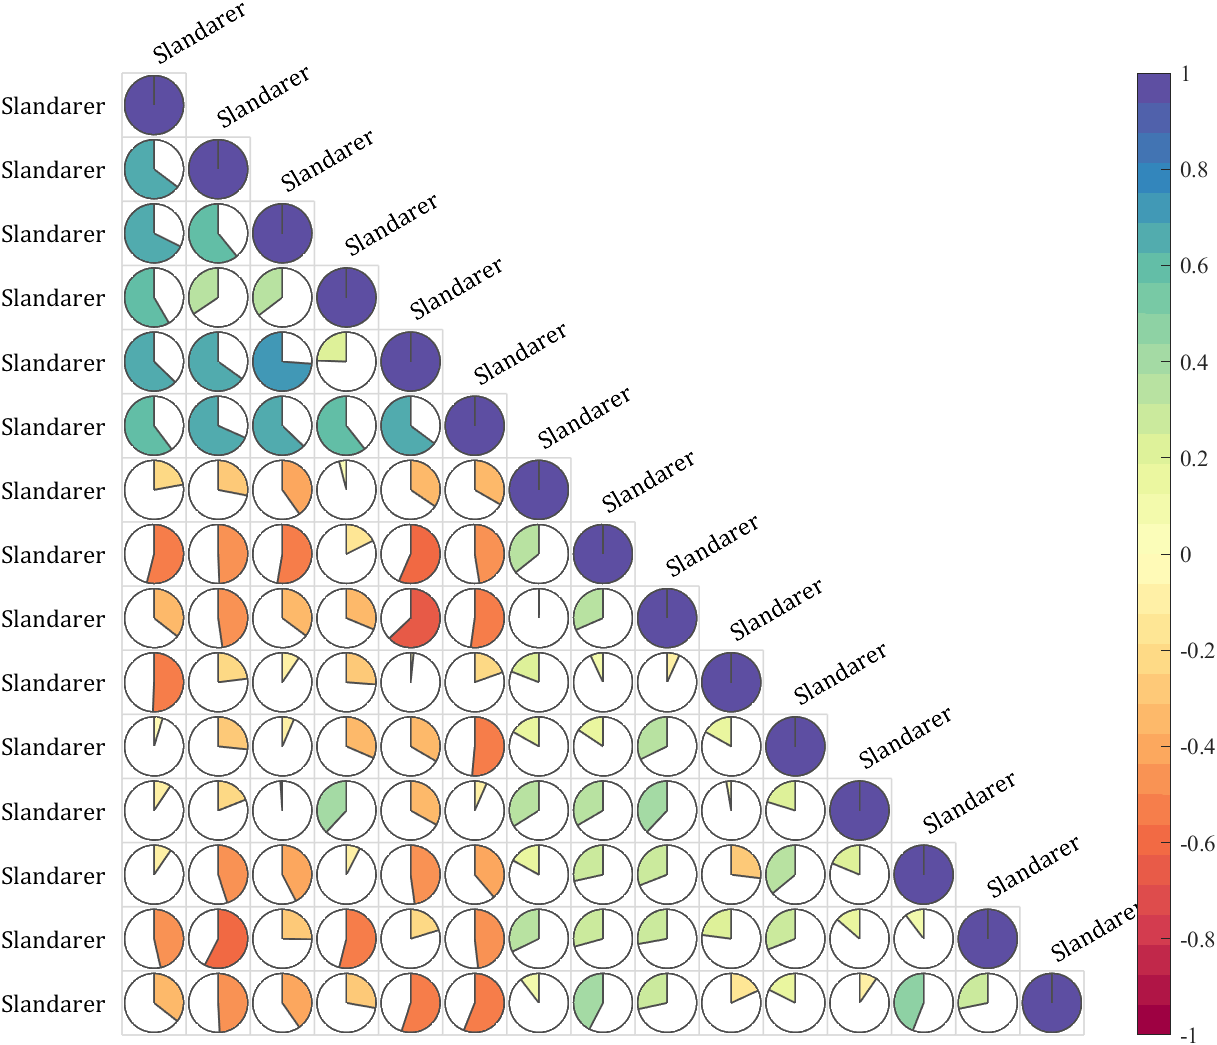
figure()
SHM_s3=SHeatmap(Data,'Format','pie');
SHM_s3=SHM_s3.draw();
SHM_s3.setType('tril');
SHM_s3.setVarName({'Slandarer'})
ax=gca;
ax.XLim(2)=ax.XLim(2)+1;
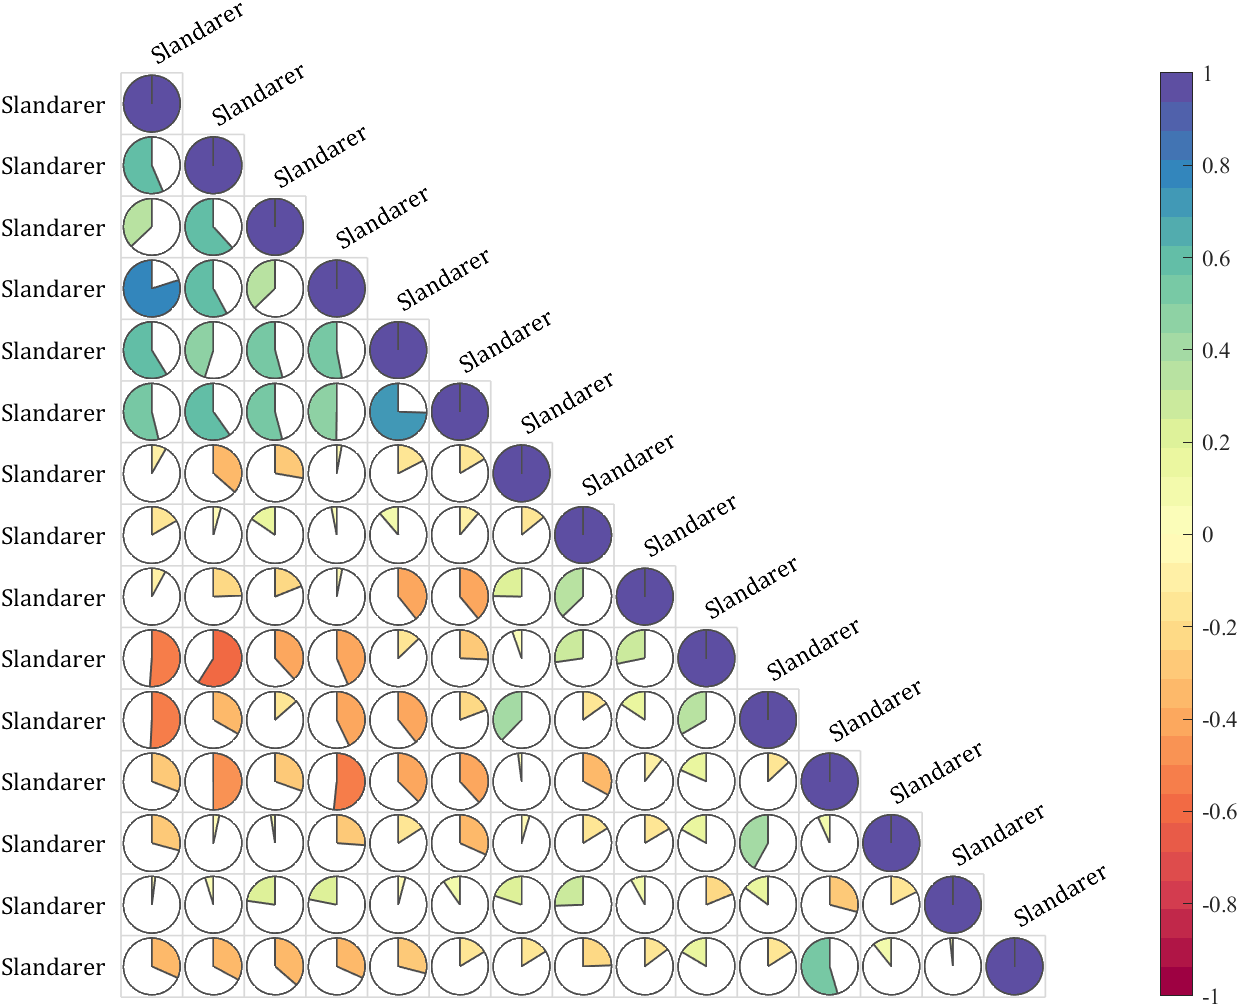
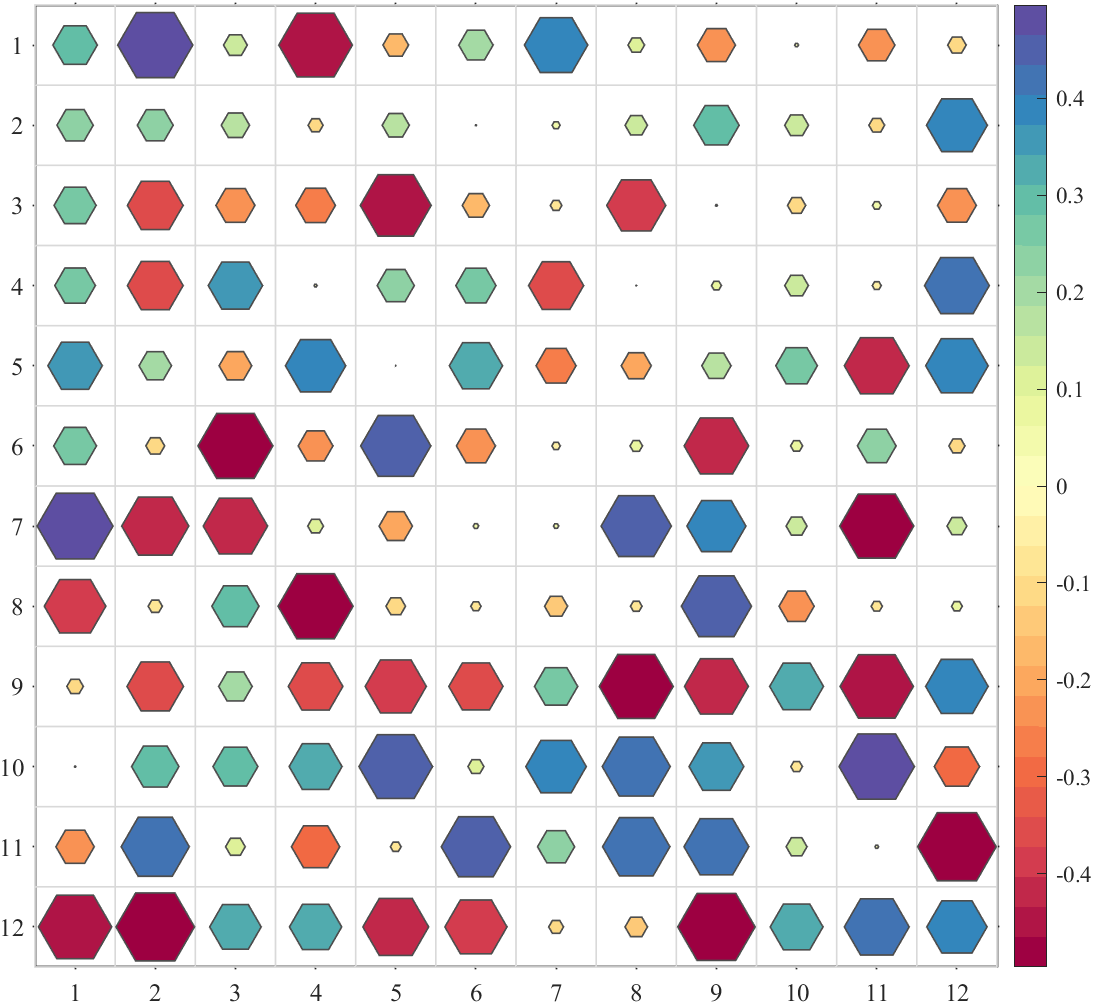
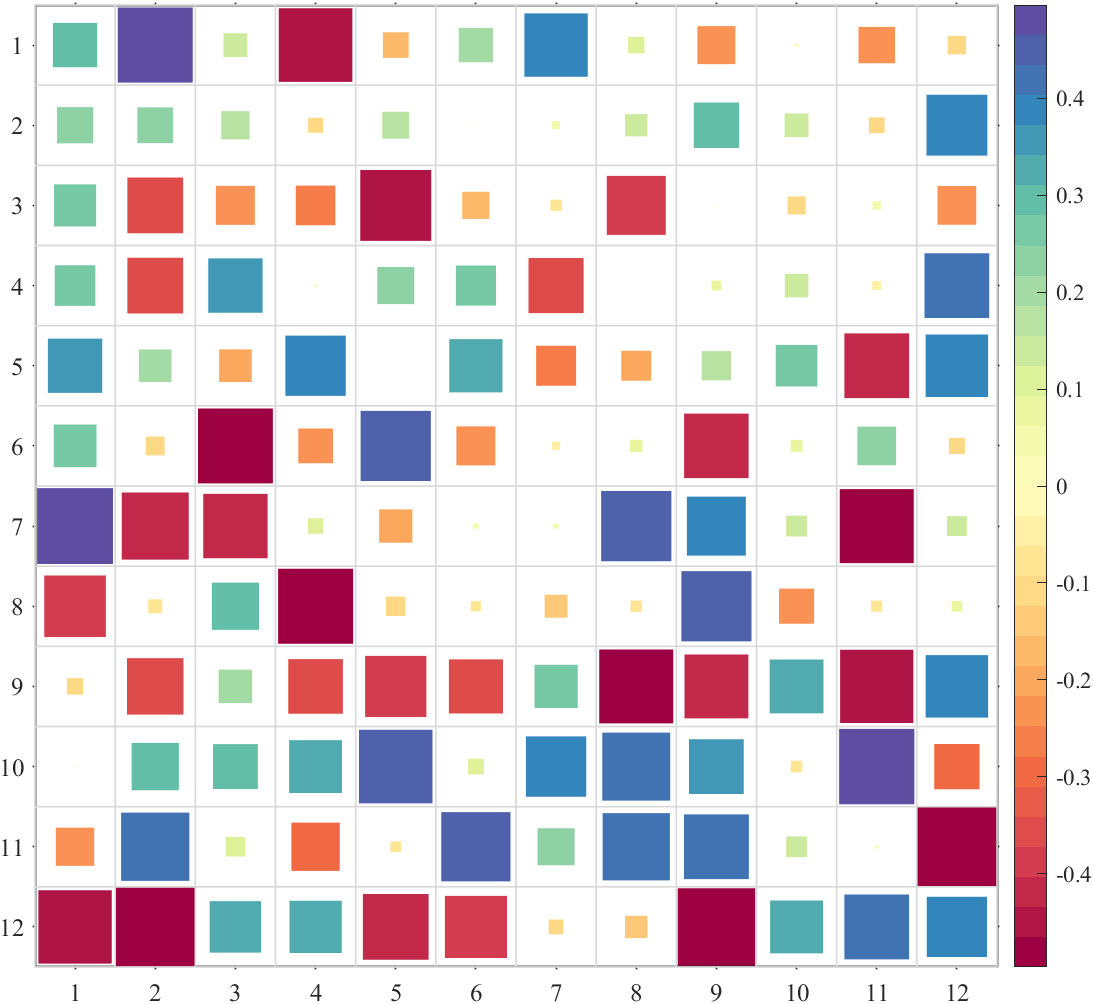
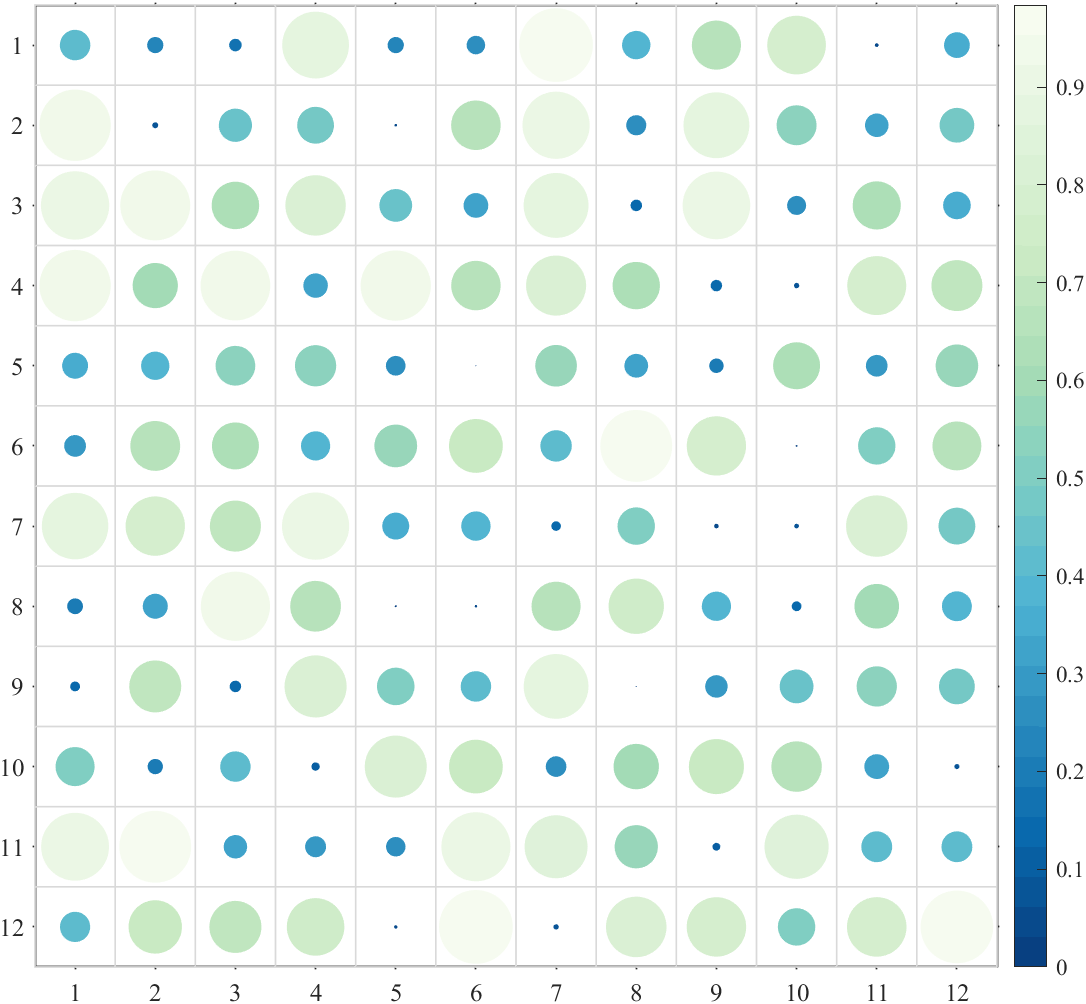
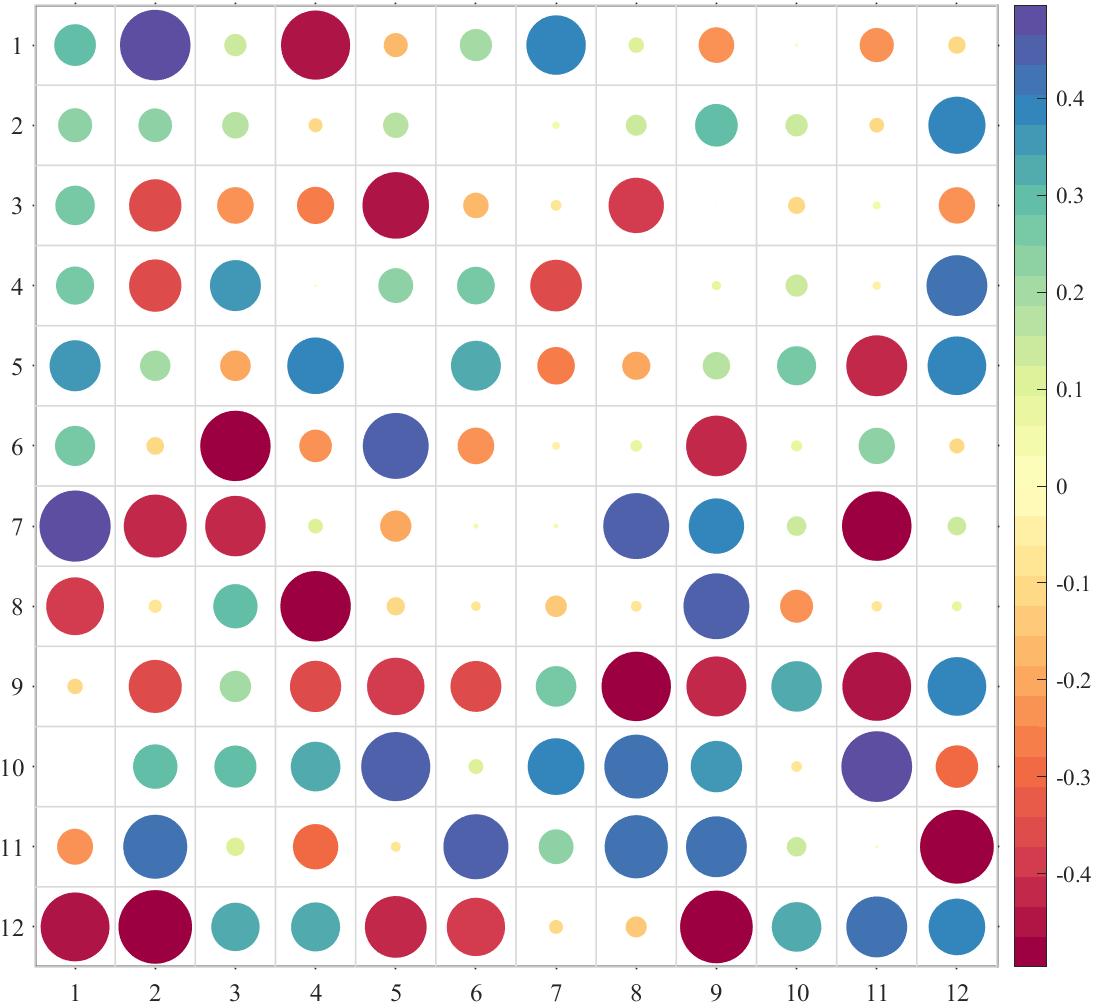
Format={'sq','pie','circ','oval','hex','asq','acirc'};
for i=1:length(Format)
    figure()
    SHM_s4=SHeatmap(Data,'Format',Format{i});
    SHM_s4=SHM_s4.draw();
    % 设置格式(set Type)
    SHM_s4.setType('triu');
    % exportgraphics(gca,['gallery\Type_triu',Format{i},'.png'])
end


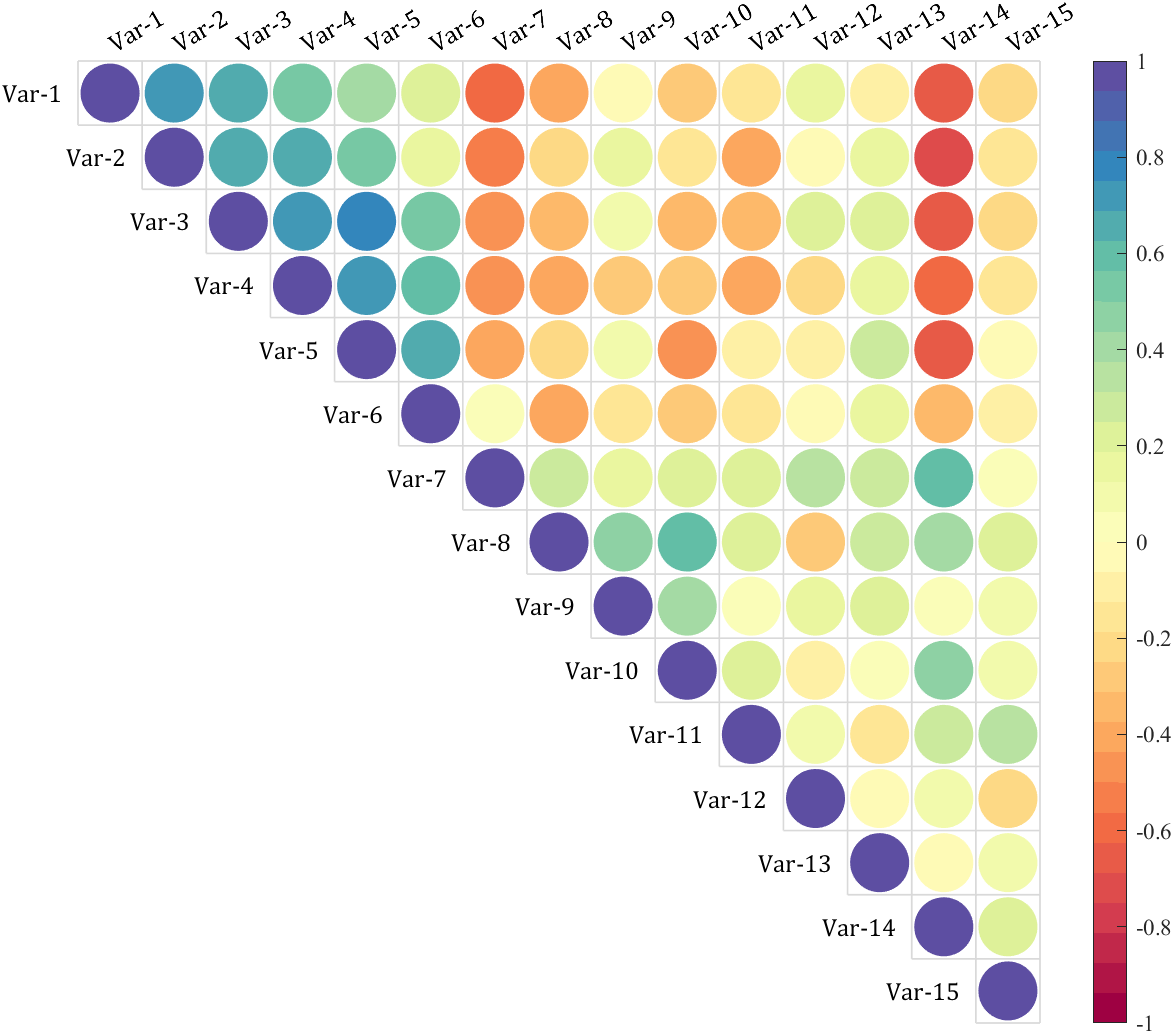
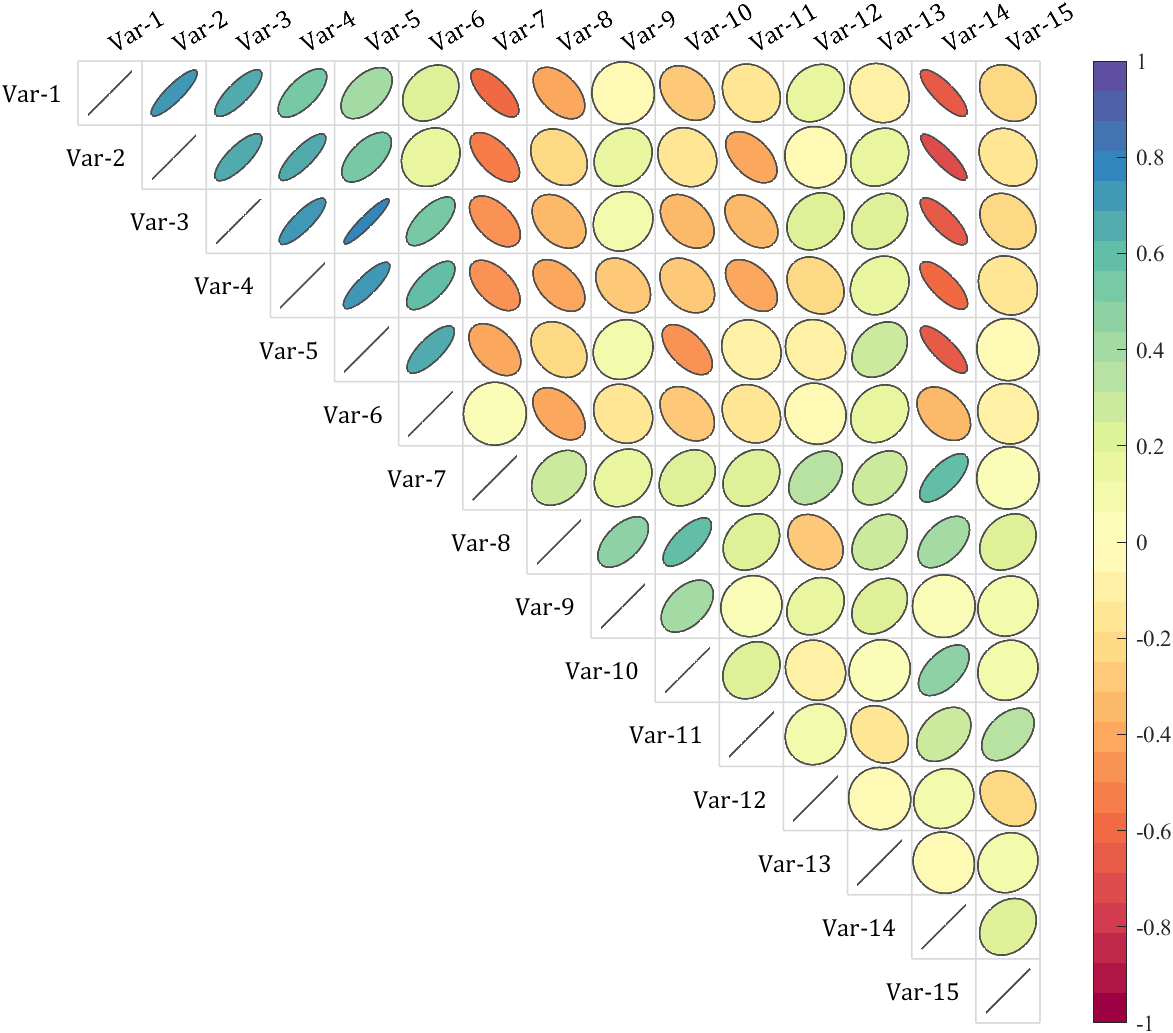

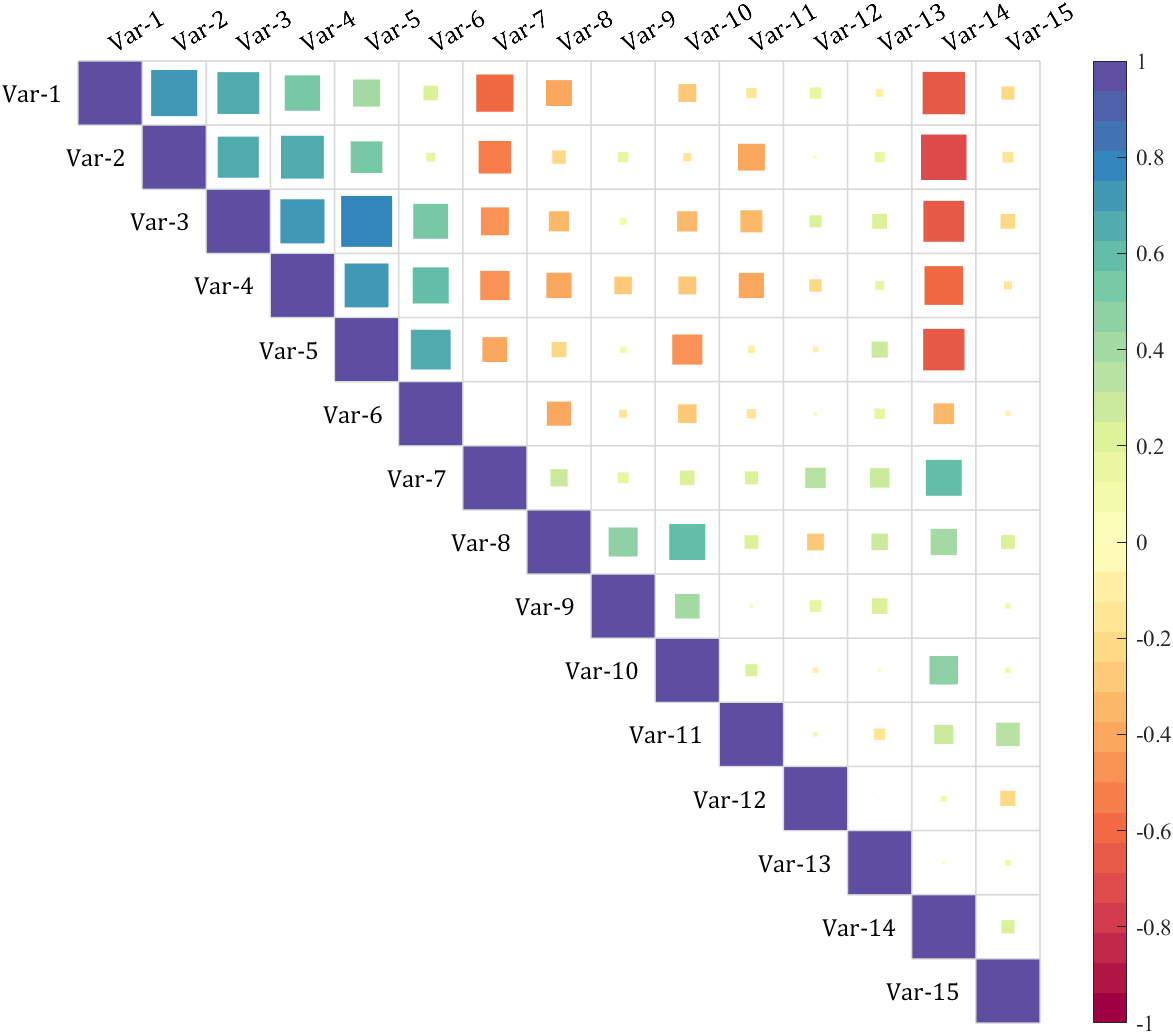

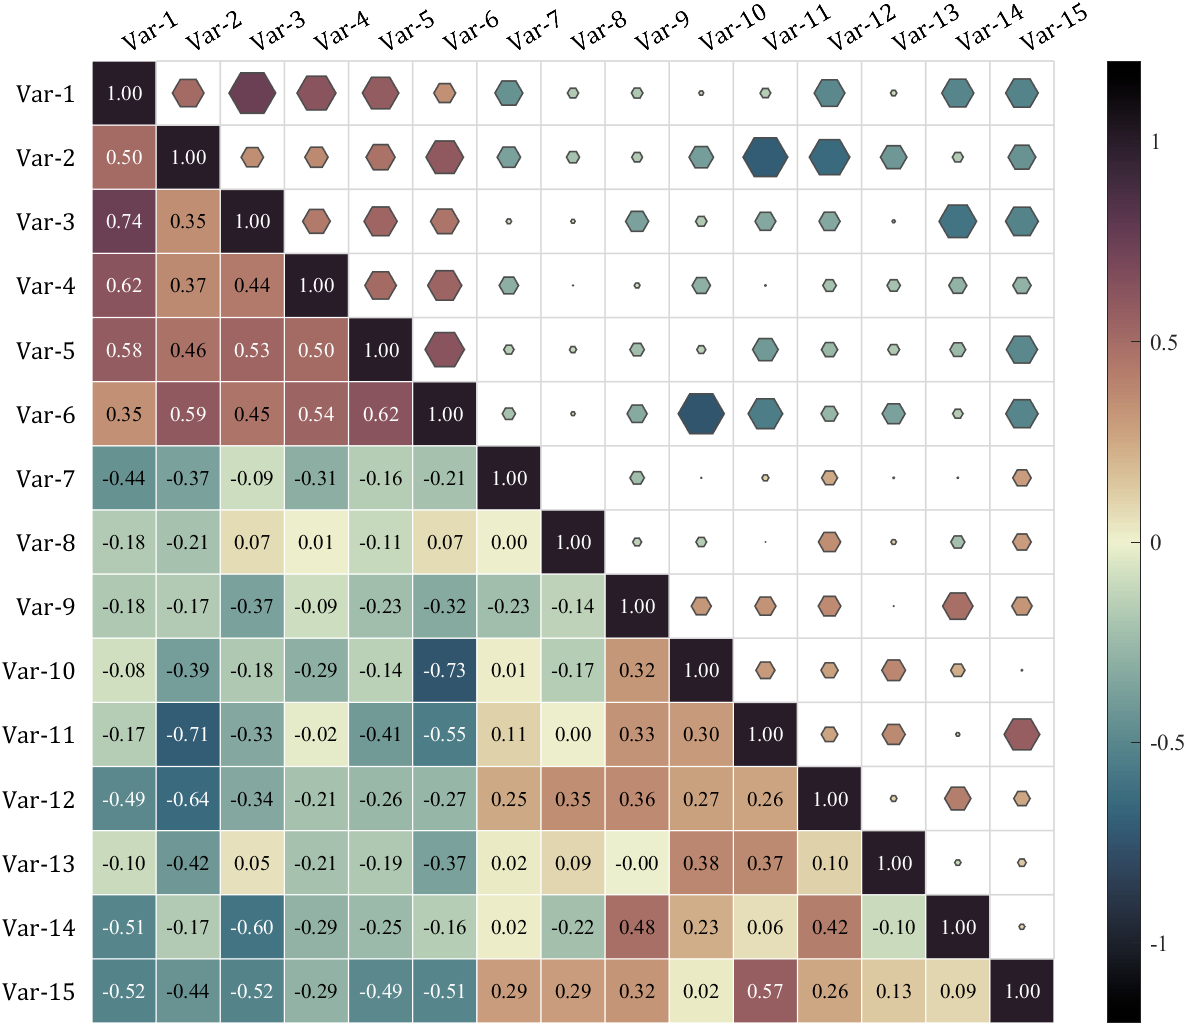
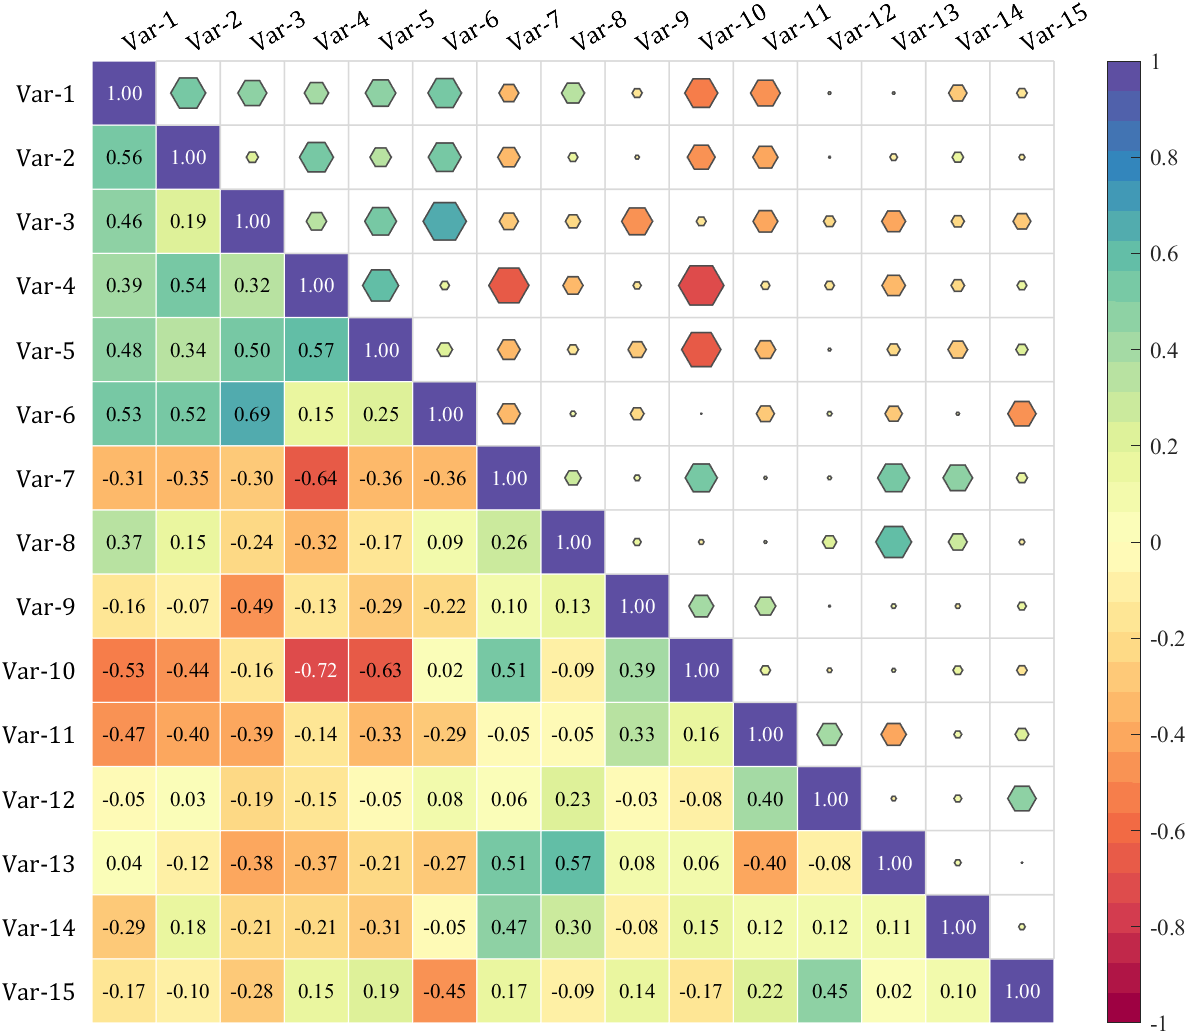
就画两次并隐藏部分字体:
% 随便捏造了点数据(Made up some data casually)
X=randn(20,15)+[(linspace(-1,2.5,20)').*ones(1,6),(linspace(.5,-.7,20)').*ones(1,5),(linspace(.9,-.2,20)').*ones(1,4)];
% 求相关系数矩阵(Get the correlation matrix)
Data=corr(X);


figure()
SHM_m1=SHeatmap(Data,'Format','sq');
SHM_m1=SHM_m1.draw();
SHM_m1=SHM_m1.setType('tril');  % 这个等号因为要增添文字很必要(This equal sign is necessary for adding text)
SHM_m1.setColLabel('Visible','off')

SHM_m2=SHeatmap(Data,'Format','hex');
SHM_m2=SHM_m2.draw();
SHM_m2.setType('triu0');
SHM_m2.setRowLabel('Visible','off')
SHM_m2.setColLabel('Visible','on') % 显示隐藏的Var-1标签(Show the hidden Var-1 label)

clim([-1.2,1.2])
colormap(slanCM(141))

SHM_m1.setText();

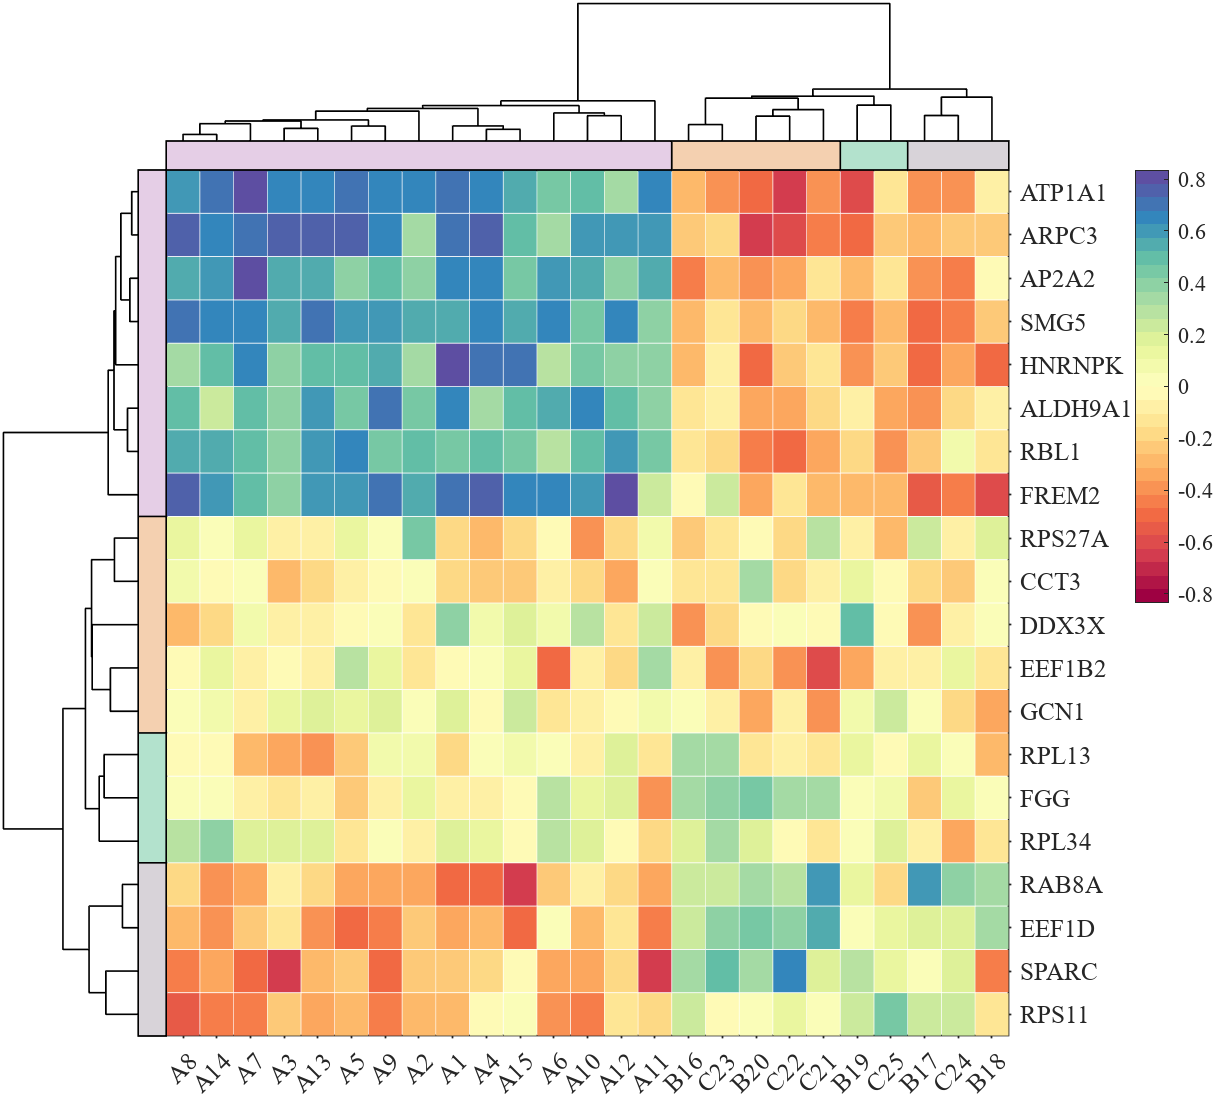
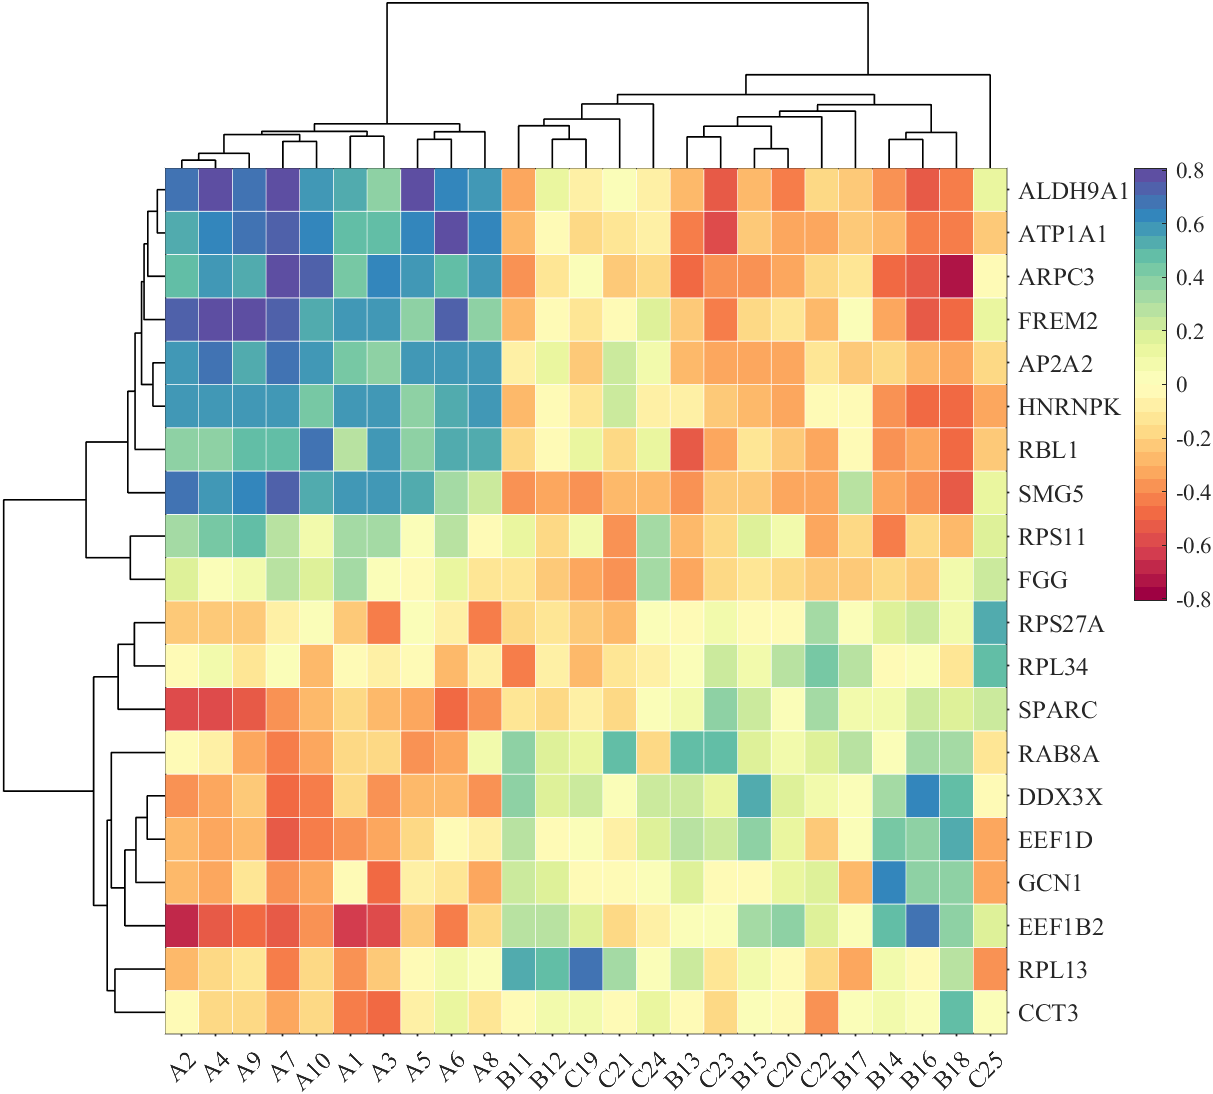
有点麻烦但一点点画吧,需要用到SDendrogram函数,这个函数最后会给出,这个函数有三个可用的参数:
'Orientation’横向树状图还是竖着,'Parent’画在哪个坐标区域,'Method’聚类方法,返回值是新的排序:
% 随便捏造了点数据(Made up some data casually)
X1=randn(20,20)+[(linspace(-1,2.5,20)').*ones(1,8),(linspace(.5,-.7,20)').*ones(1,5),(linspace(.9,-.2,20)').*ones(1,7)];
X2=randn(20,25)+[(linspace(-1,2.5,20)').*ones(1,10),(linspace(.5,-.7,20)').*ones(1,8),(linspace(.9,-.2,20)').*ones(1,7)];
% 求相关系数矩阵(Get the correlation matrix)
Data=corr(X1,X2);
% rowName and colName
rowName={'FREM2','ALDH9A1','RBL1','AP2A2','HNRNPK','ATP1A1','ARPC3','SMG5','RPS27A',...
          'RAB8A','SPARC','DDX3X','EEF1D','EEF1B2','RPS11','RPL13','RPL34','GCN1','FGG','CCT3'};
colName={'A1','A2','A3','A4','A5','A6','A7','A8','A9','A10','B11','B12','B13',...
         'B14','B15','B16','B17','B18','C19','C20','C21','C22','C23','C24','C25'};

% 图窗创建(create figure)
fig=figure('Position',[100,100,870,720]);

% 调整主坐标区域位置并将Y轴置于右侧
% Adjust the position of the main coordinate area
% and place the Y axis to the right
axMain=axes('Parent',fig);
axMain.Position=[.18,.07,.62,.77];
P=axMain.Position;
axMain.YAxisLocation='right';

% 绘制左侧树状图(Draw the left dendrogram)
axTreeL=axes('Parent',fig);
axTreeL.Position=[P(1)-P(3)/5,P(2),P(3)/5,P(4)];
orderL=SDendrogram(Data,'Orientation','left','Parent',axTreeL);

% 绘制顶部树状图(Draw the top dendrogram)
axTreeT=axes('Parent',fig);
axTreeT.Position=[P(1),P(2)+P(4),.62,P(4)/5];
orderT=SDendrogram(Data,'Orientation','top','Parent',axTreeT);

% 交换数据顺序(Exchange data order)
Data=Data(orderL,:);
Data=Data(:,orderT);

% 绘制热图(Draw Heatmap)
SHM_t1=SHeatmap(Data,'Format','sq','Parent',axMain);
SHM_t1=SHM_t1.draw();
axMain.DataAspectRatioMode='auto';
axMain.XTickLabel=colName(orderT);
axMain.YTickLabel=rowName(orderL);
CB=colorbar(axMain);
CB.Position=[P(1)+P(3)*1.15,P(2)+P(4)/2,P(3)/25,P(4)/2];
需要使用SClusterBlock函数,主要的参数有:
'Orientation’横向还是竖着,'MinLim’绘制的位置下限,'Parent’画在哪个坐标区域,'ColorList’配色列表,返回值X,Y是每一个块的中心坐标,为了方便之后添加文本:
% 随便捏造了点数据(Made up some data casually)
ClassCol=[1,1,1,1,2,1,2,2,2,2,3,3,3,3,3,4,4,4,4,4,5,5,5,5,5];
ClassRow=[1,1,1,1,1,2,2,2,2,2,3,3,3,3,3,4,4,4,4,4];
Data=rand(20,25);

% 图窗创建(create figure)
fig=figure('Position',[100,100,800,800]);

% 调整主坐标区域位置并将Y轴置于右侧
% Adjust the position of the main coordinate area
% and place the Y axis to the right
axMain=axes('Parent',fig);
axMain.Position=[.1,.05,.85,.85];
P=axMain.Position;
axMain.YAxisLocation='right';

% 绘制左侧分组方块(Draw the left Block)
axBlockL=axes('Parent',fig);
axBlockL.Position=[P(1)-P(3)/20-P(3)*.01,P(2),P(3)/20,P(4)];
SClusterBlock(ClassRow,'Orientation','left','Parent',axBlockL);

% 绘制上侧分组方块(Draw the top Block)
axBlockT=axes('Parent',fig);
axBlockT.Position=[P(1),P(2)+P(4)*1.01,P(3),P(4)/20];
SClusterBlock(ClassCol,'Orientation','top','Parent',axBlockT);

% 绘制热图(Draw Heatmap)
SHM_b1=SHeatmap(Data,'Format','sq','Parent',axMain);
SHM_b1=SHM_b1.draw();
axMain.DataAspectRatioMode='auto';
colorbar(axMain,'off');
clim(axMain,[-.2,1])

绘制多次的同时改一下MinLim属性,同时下面这个例子利用了返回值填上了标签:
Data=rand(3,16);

Class1=[1,1,1,1,2,2,2,2,3,3,3,3,4,4,4,4];
Class2=[1,2,3,4,1,2,3,4,1,2,3,4,1,2,3,4];
ClassName1={'AAAAA','BBBBB','CCCCC','DDDDD'};
ClassName2={'A1','A2','A3','A4','B1','B2','B3','B4','C1','C2','C3','C4','D1','D2','D3','D4'};

% 设置颜色(Set Color)
CList1=[0.7020    0.8863    0.8039
    0.9559    0.8142    0.6907
    0.8451    0.8275    0.8510
    0.8966    0.8083    0.9000];
CList2=[0.4588    0.4196    0.6941
    0.6196    0.6039    0.7843
    0.7373    0.7412    0.8627
    0.8549    0.8549    0.9216];

% 图窗及坐标区域创建(create figure and axes)
fig=figure('Position',[100,100,1000,320]);
axMain=axes('Parent',fig);
axMain.Position=[.05,0,.9,.78];
P=axMain.Position;

% Draw Heatmap
SHM5=SHeatmap(Data,'Format','sq','Parent',axMain);
SHM5=SHM5.draw();
CB=colorbar;
CB.Location='southoutside';
axMain.DataAspectRatioMode='auto';

% Draw Block
axBlockT=axes('Parent',fig);
axBlockT.Position=[P(1),P(2)+P(4)*1.05,P(3),P(4)/5];
[X1,Y1]=SClusterBlock(Class1,'Orientation','top','Parent',axBlockT,'MinLim',1,'ColorList',CList1);
[X2,Y2]=SClusterBlock(Class2,'Orientation','top','Parent',axBlockT,'ColorList',CList2);

% text
for i=1:length(X1)
    text(axBlockT,X1(i),Y1(i),ClassName1{i},'FontSize',17,'HorizontalAlignment','center','FontName','Cambria')
end
for i=1:length(X2)
    text(axBlockT,X2(i),Y2(i),ClassName2{i},'FontSize',17,'HorizontalAlignment','center','FontName','Cambria')
end

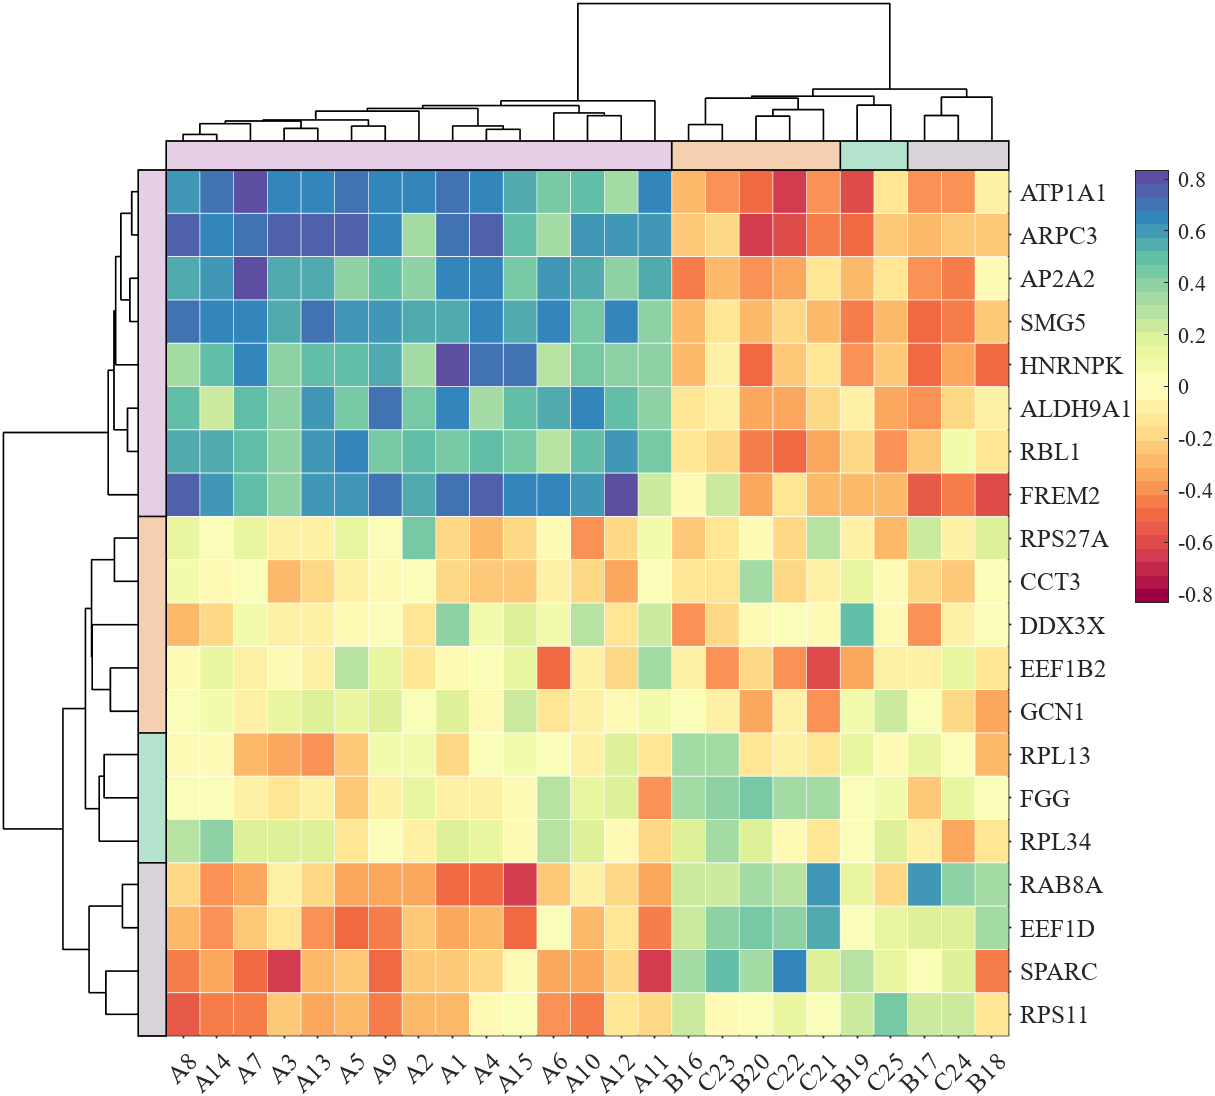
大家可以自行改变聚类方法及分类数量:
% 随便捏造了点数据(Made up some data casually)
X1=randn(20,20)+[(linspace(-1,2.5,20)').*ones(1,8),(linspace(.5,-.7,20)').*ones(1,5),(linspace(.9,-.2,20)').*ones(1,7)];
X2=randn(20,25)+[(linspace(-1,2.5,20)').*ones(1,15),(linspace(.5,-.7,20)').*ones(1,5),(linspace(.9,-.2,20)').*ones(1,5)];
% 求相关系数矩阵(Get the correlation matrix)
Data=corr(X1,X2);
% rowName and colName
rowName={'FREM2','ALDH9A1','RBL1','AP2A2','HNRNPK','ATP1A1','ARPC3','SMG5','RPS27A',...
          'RAB8A','SPARC','DDX3X','EEF1D','EEF1B2','RPS11','RPL13','RPL34','GCN1','FGG','CCT3'};
colName={'A1','A2','A3','A4','A5','A6','A7','A8','A9','A10','A11','A12','A13',...
         'A14','A15','B16','B17','B18','B19','B20','C21','C22','C23','C24','C25'};
% Set Color
CList=[0.7020    0.8863    0.8039
    0.9559    0.8142    0.6907
    0.8451    0.8275    0.8510
    0.8966    0.8083    0.9000];

% 图窗创建(create figure)
fig=figure('Position',[100,100,870,720]);

% 调整主坐标区域位置并将Y轴置于右侧
% Adjust the position of the main coordinate area
% and place the Y axis to the right
axMain=axes('Parent',fig);
axMain.Position=[.18,.07,.62,.77];
P=axMain.Position;
axMain.YAxisLocation='right';

% 绘制左侧树状图(Draw the left dendrogram)
axTreeL=axes('Parent',fig);
axTreeL.Position=[P(1)-P(3)/5,P(2),P(3)/5*(5/6),P(4)];
orderL=SDendrogram(Data,'Orientation','left','Parent',axTreeL,'Method','average');

% 绘制顶部树状图(Draw the top dendrogram)
axTreeT=axes('Parent',fig);
axTreeT.Position=[P(1),P(2)+P(4)+P(4)/5*(1/6),P(3),P(4)/5*(5/6)];
orderT=SDendrogram(Data,'Orientation','top','Parent',axTreeT,'Method','average');

% 绘制左侧分组方块(Draw the left Block)
axBlockL=axes('Parent',fig);
axBlockL.Position=[P(1)-P(3)/5+P(3)/5*(5/6),P(2),P(3)/5*(1/6),P(4)];
ZL=linkage(Data,'average');
CL=cluster(ZL,'Maxclust',4);
CL=CL(orderL);
SClusterBlock(CL,'Orientation','left','Parent',axBlockL,'ColorList',CList);

% 绘制顶部分组方块(Draw the top Block)
axBlockT=axes('Parent',fig);
axBlockT.Position=[P(1),P(2)+P(4),P(3),P(4)/5*(1/6)];
ZT=linkage(Data.','average');
CT=cluster(ZT,'Maxclust',4);
CT=CT(orderT);
SClusterBlock(CT,'Orientation','top','Parent',axBlockT,'ColorList',CList);

% 交换数据顺序(Exchange data order)
Data=Data(orderL,:);
Data=Data(:,orderT);

% 绘制热图(Draw Heatmap)
SHM_t1=SHeatmap(Data,'Format','sq','Parent',axMain);
SHM_t1=SHM_t1.draw();
axMain.DataAspectRatioMode='auto';
axMain.XTickLabel=colName(orderT);
axMain.YTickLabel=rowName(orderL);
CB=colorbar(axMain);
CB.Position=[P(1)+P(3)*1.15,P(2)+P(4)/2,P(3)/25,P(4)/2];
把代码增添了大量注释:
%% 绘制无负数的热图(Draw positive heat map)
figure()
Data=rand(15,15);
SHM1=SHeatmap(Data,'Format','sq');
SHM1=SHM1.draw();
% exportgraphics(gca,'gallery\Basic_positive.png')

%% 绘制有负数热图(Contains negative numbers)
figure()
Data=rand(15,15)-.5;
SHM2=SHeatmap(Data,'Format','sq');
SHM2=SHM2.draw();
% exportgraphics(gca,'gallery\Basic_negative.png')

%% 绘制不同大小热图(Draw heat maps of different sizes)
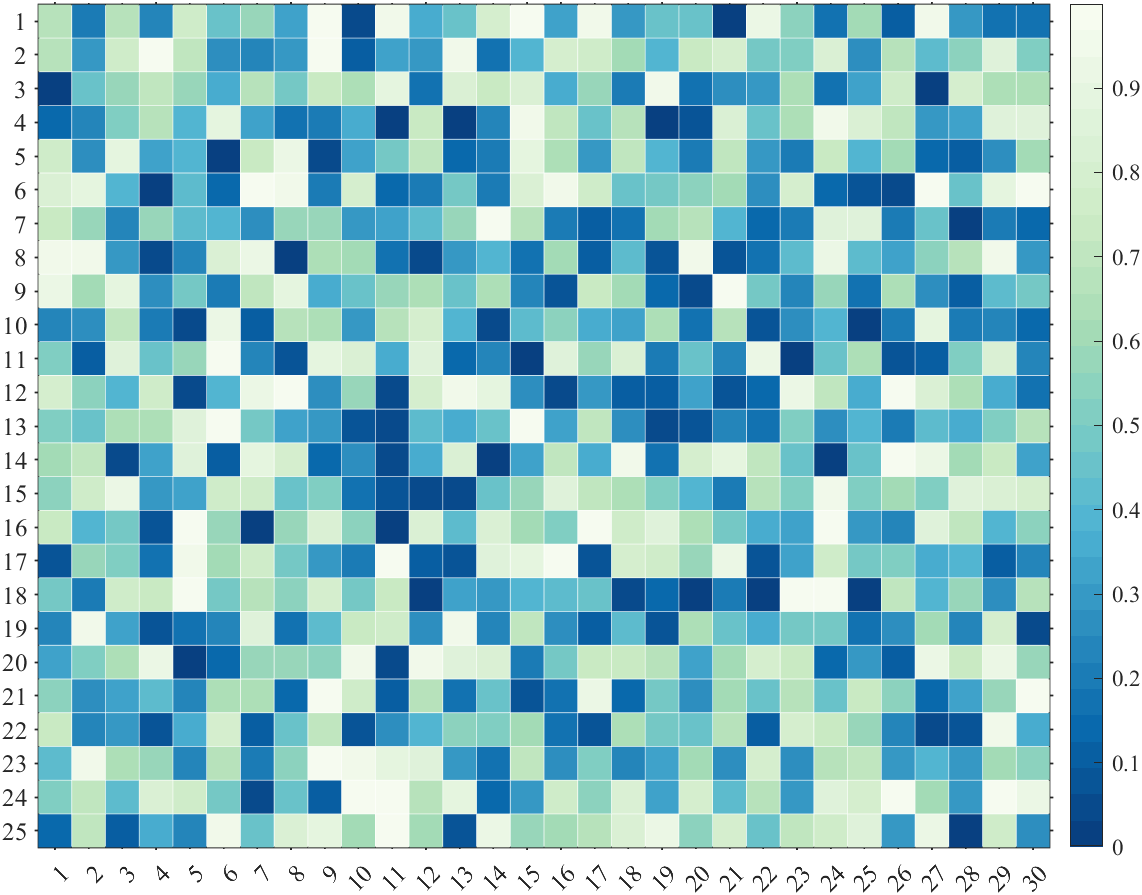
figure()
Data=rand(25,30);
SHM4=SHeatmap(Data,'Format','sq');
SHM4=SHM4.draw();
% exportgraphics(gca,'gallery\Basic_25_30.png')

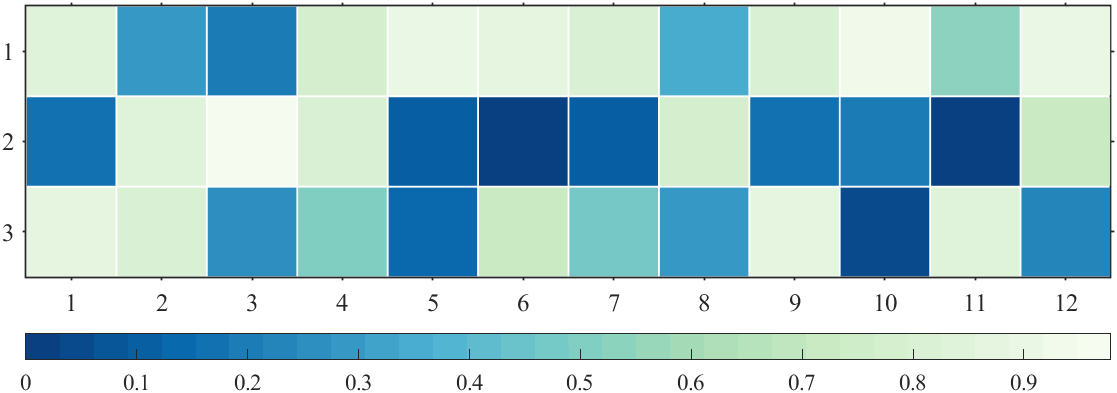
%% 调整colorbar位置(Adjust the colorbar Location)
figure()
Data=rand(3,12);
SHM5=SHeatmap(Data,'Format','sq');
SHM5=SHM5.draw();
CB=colorbar;
CB.Location='southoutside';
% exportgraphics(gca,'gallery\Basic_colorbar_location.png')

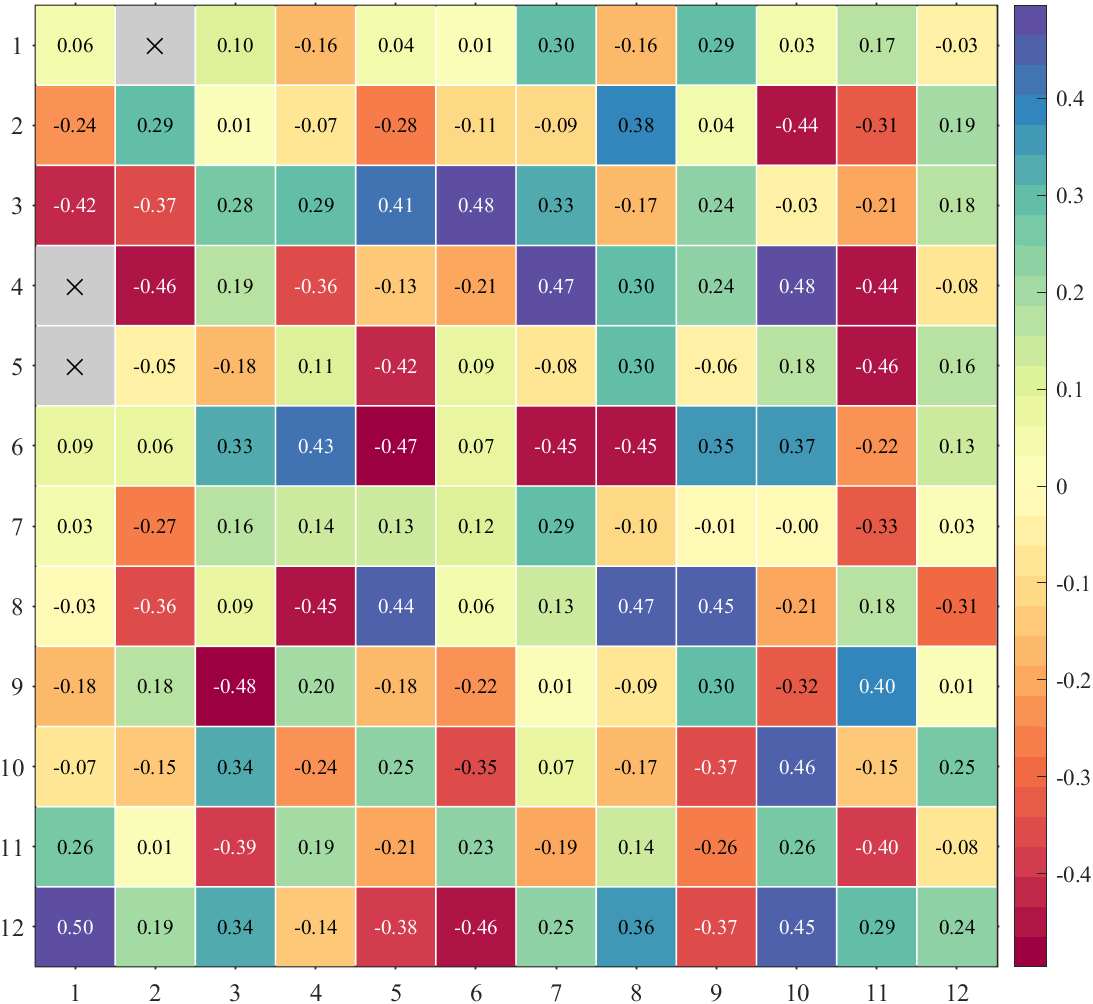
%% 绘制有NaN热图(Draw heat map with NaN)
figure()
Data=rand(12,12)-.5;
Data([4,5,13])=nan;
SHM6=SHeatmap(Data,'Format','sq');
SHM6=SHM6.draw();
% exportgraphics(gca,'gallery\Basic_with_NaN.png')

%% 绘制有文本热图(Draw heat map with texts)
figure()
Data=rand(12,12)-.5;
Data([4,5,13])=nan;
SHM7=SHeatmap(Data,'Format','sq');
SHM7=SHM7.draw();
SHM7.setText();
% exportgraphics(gca,'gallery\Basic_with_text.png')

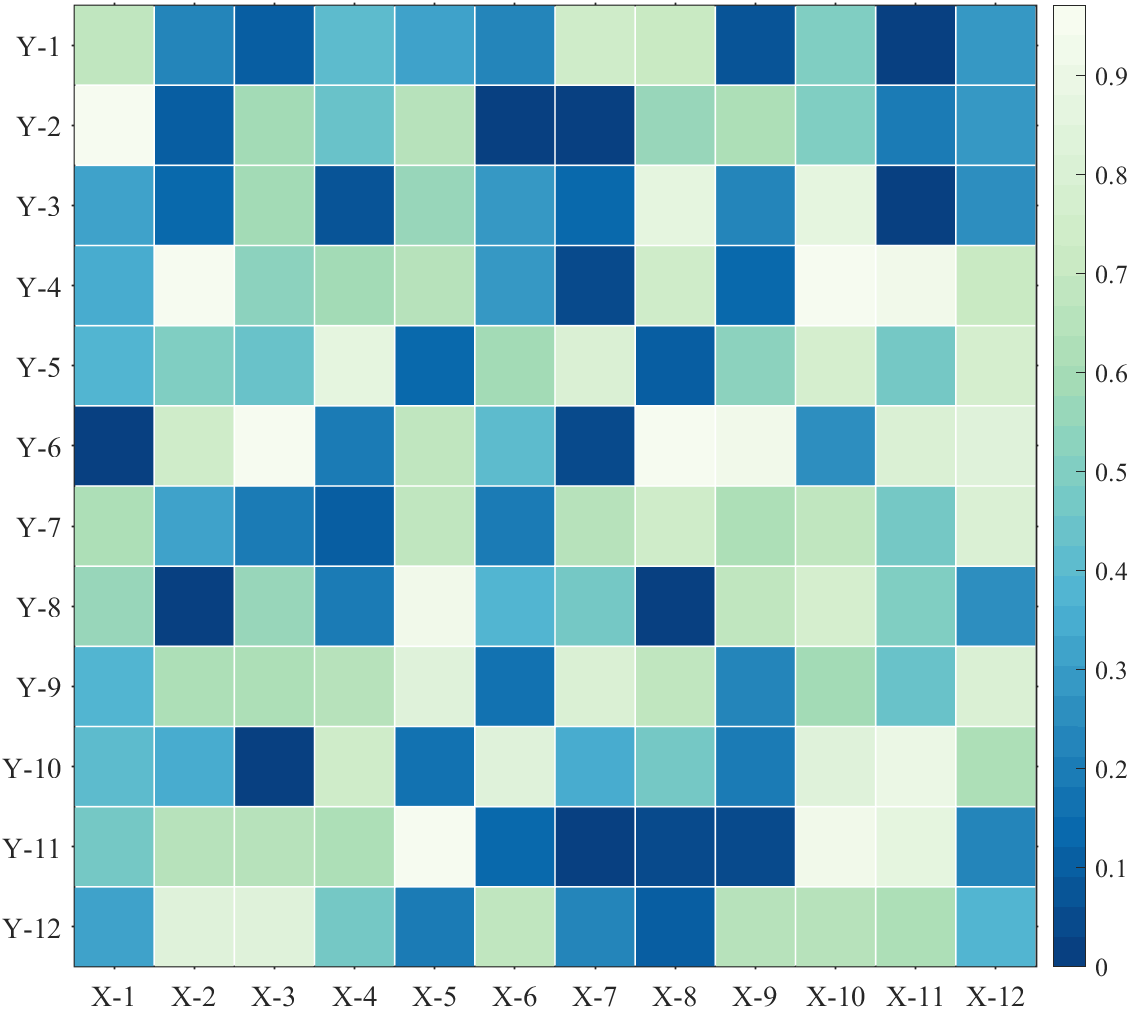
%% 绘制带标签热图(Draw heat map with labels)
figure()
Data=rand(12,12);
SHM8=SHeatmap(Data,'Format','sq');
SHM8=SHM8.draw();
ax=gca;
ax.XTickLabel={'X-1','X-2','X-3','X-4','X-5','X-6','X-7','X-8','X-9','X-10','X-11','X-12'};
ax.YTickLabel={'Y-1','Y-2','Y-3','Y-4','Y-5','Y-6','Y-7','Y-8','Y-9','Y-10','Y-11','Y-12'};
ax.FontSize=14;
% exportgraphics(gca,'gallery\Basic_with_labels.png')
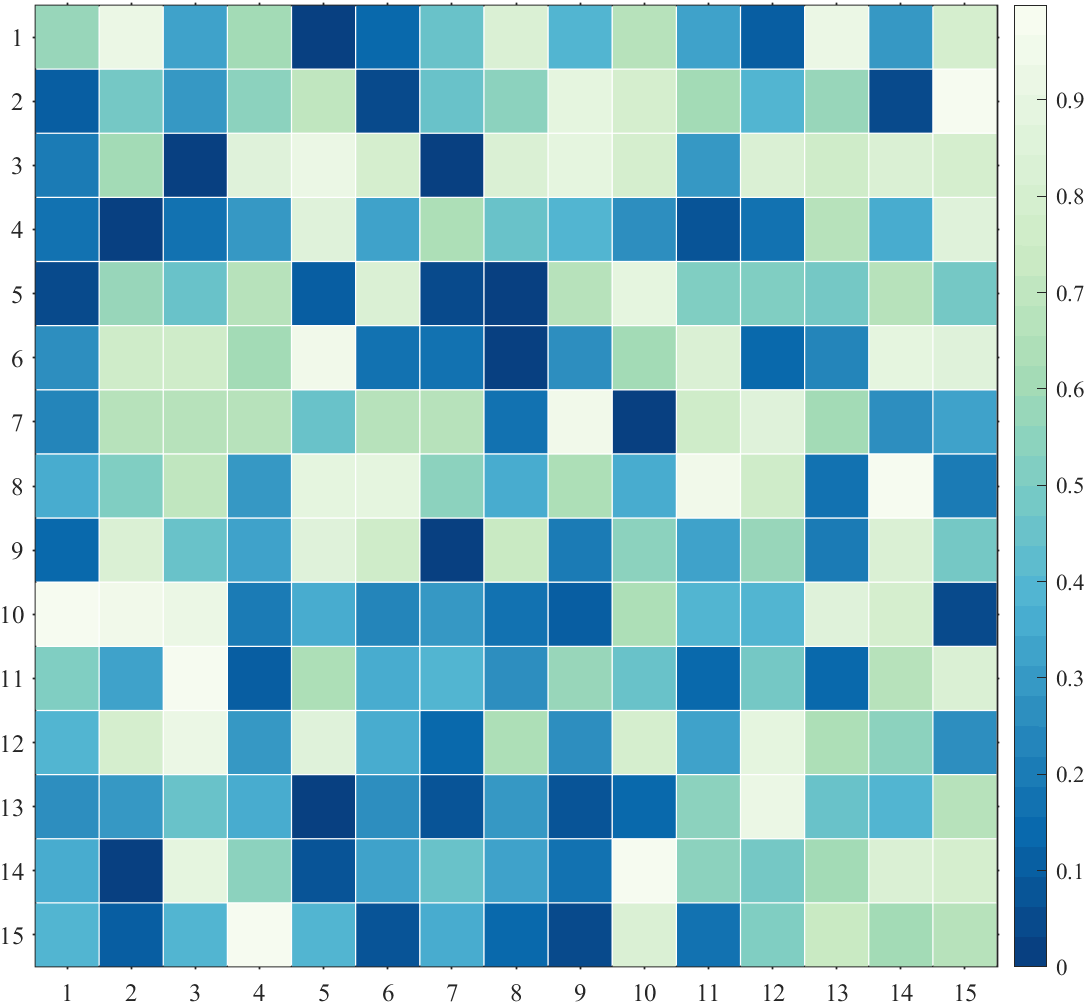
绘制无负数的热图(Draw positive heat map)
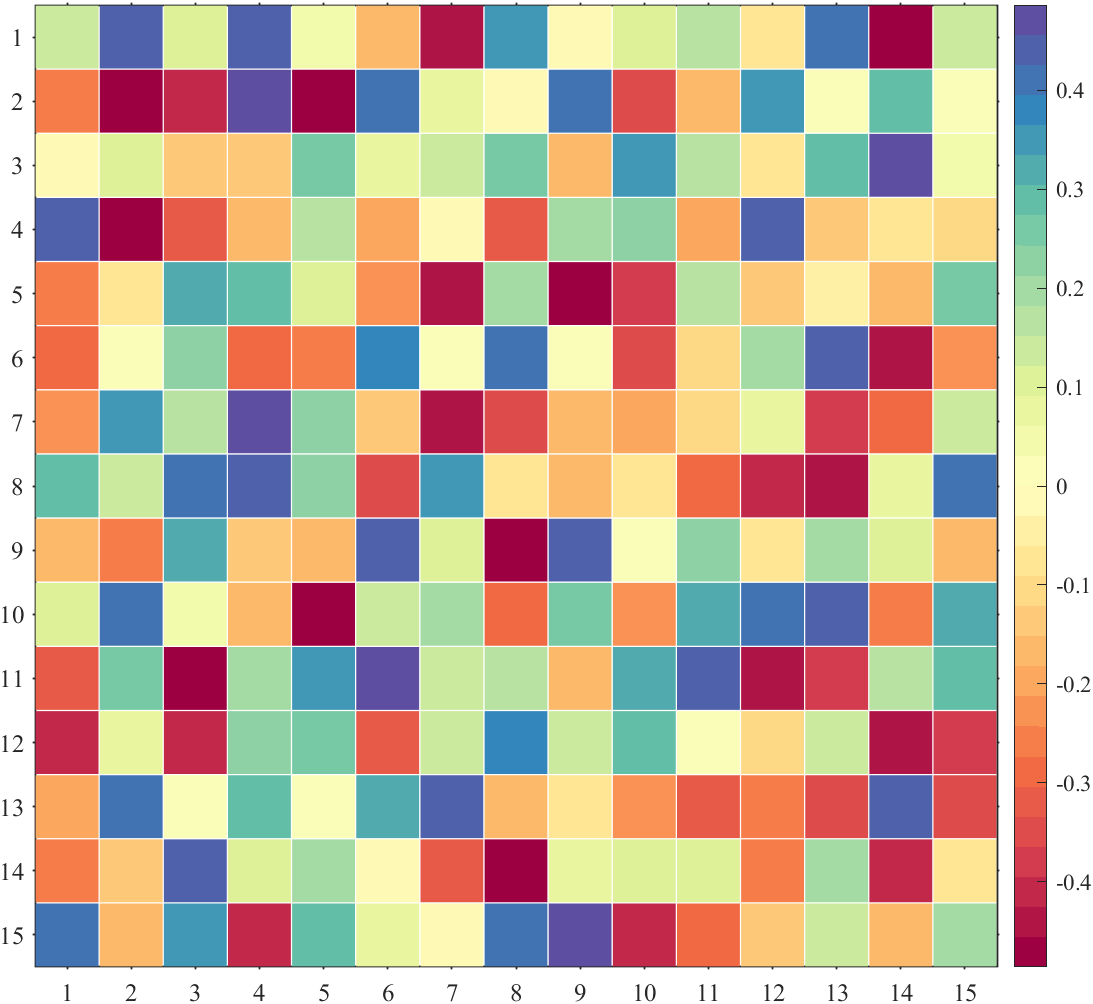
绘制有负数热图(Contains negative numbers)
绘制不同大小热图(Draw heat maps of different sizes)
调整colorbar位置(Adjust the colorbar Location)
绘制有NaN热图(Draw heat map with NaN)

绘制有文本热图(Draw heat map with texts)
绘制带标签热图(Draw heat map with labels)
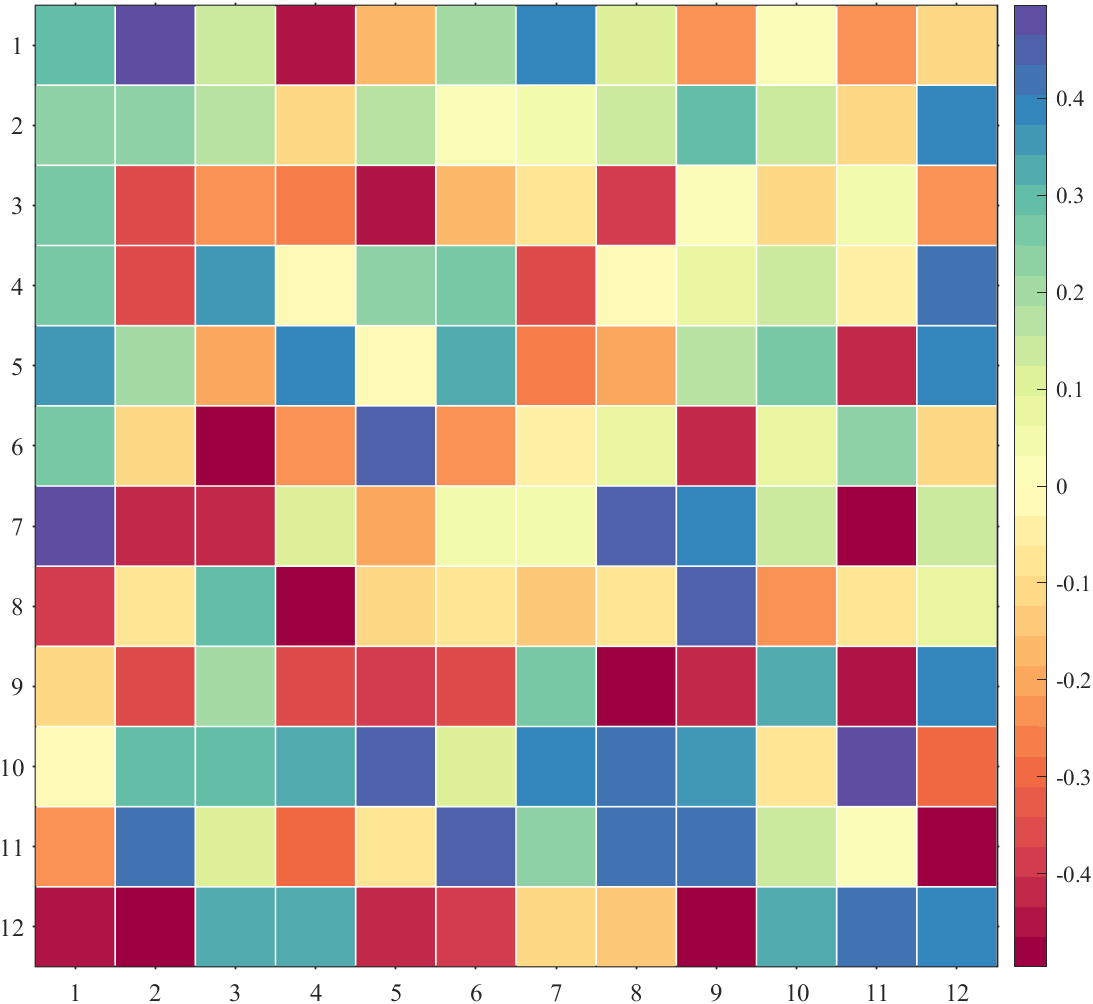
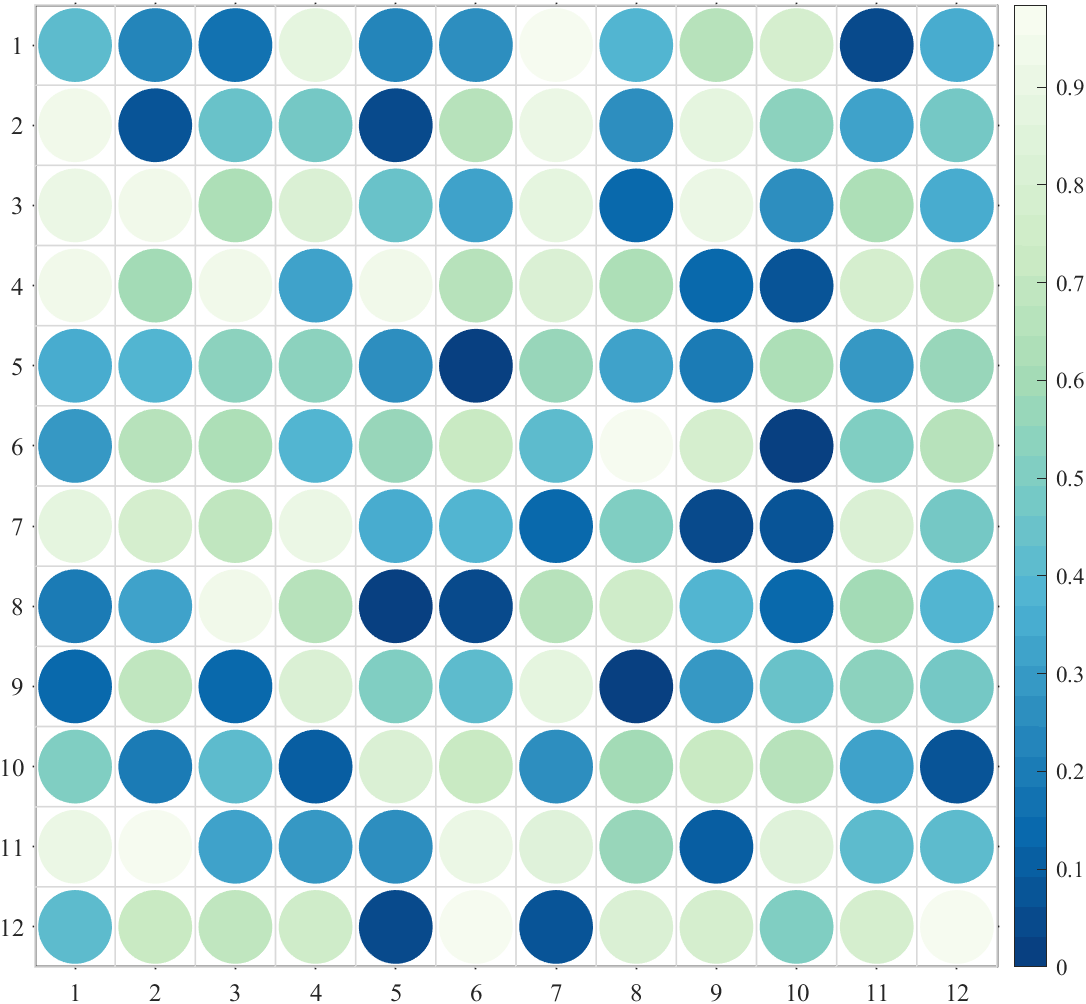
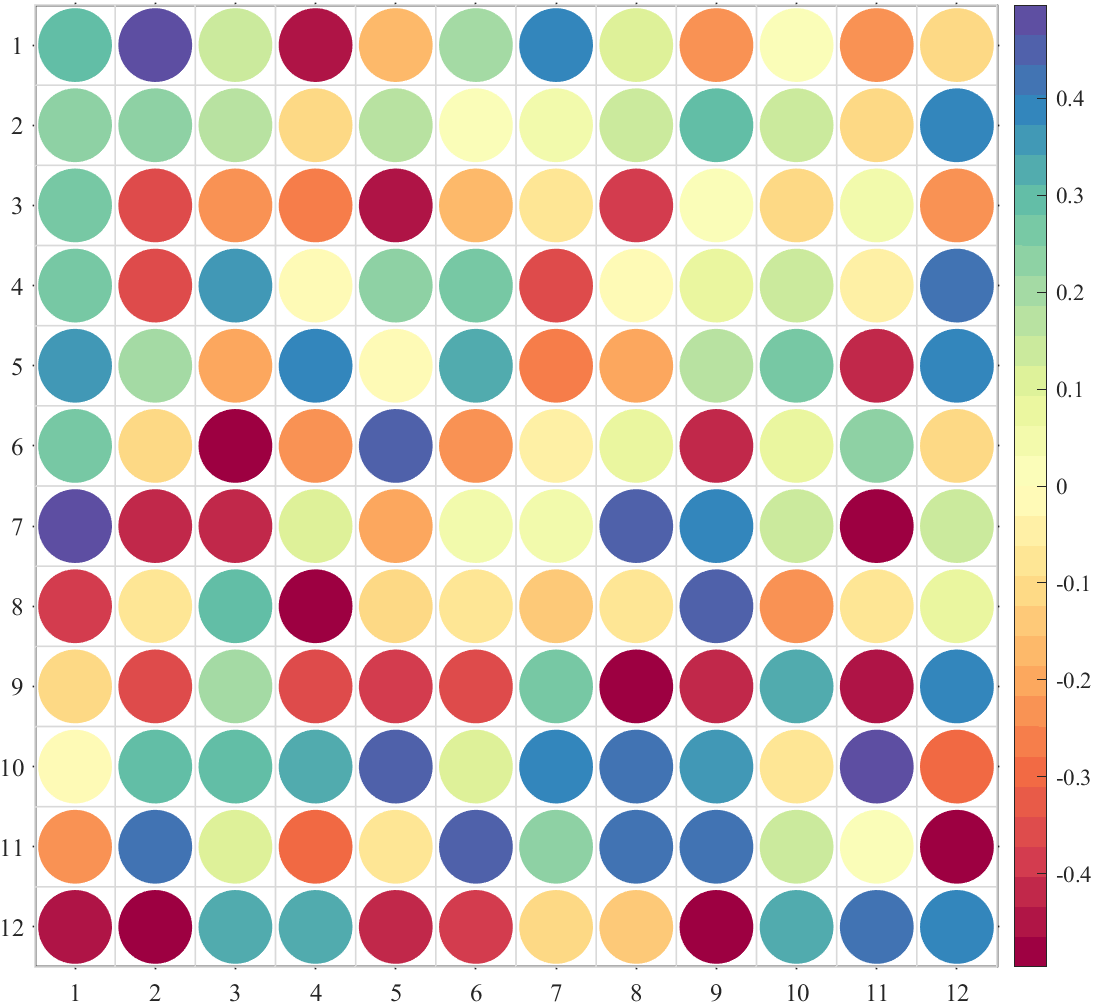
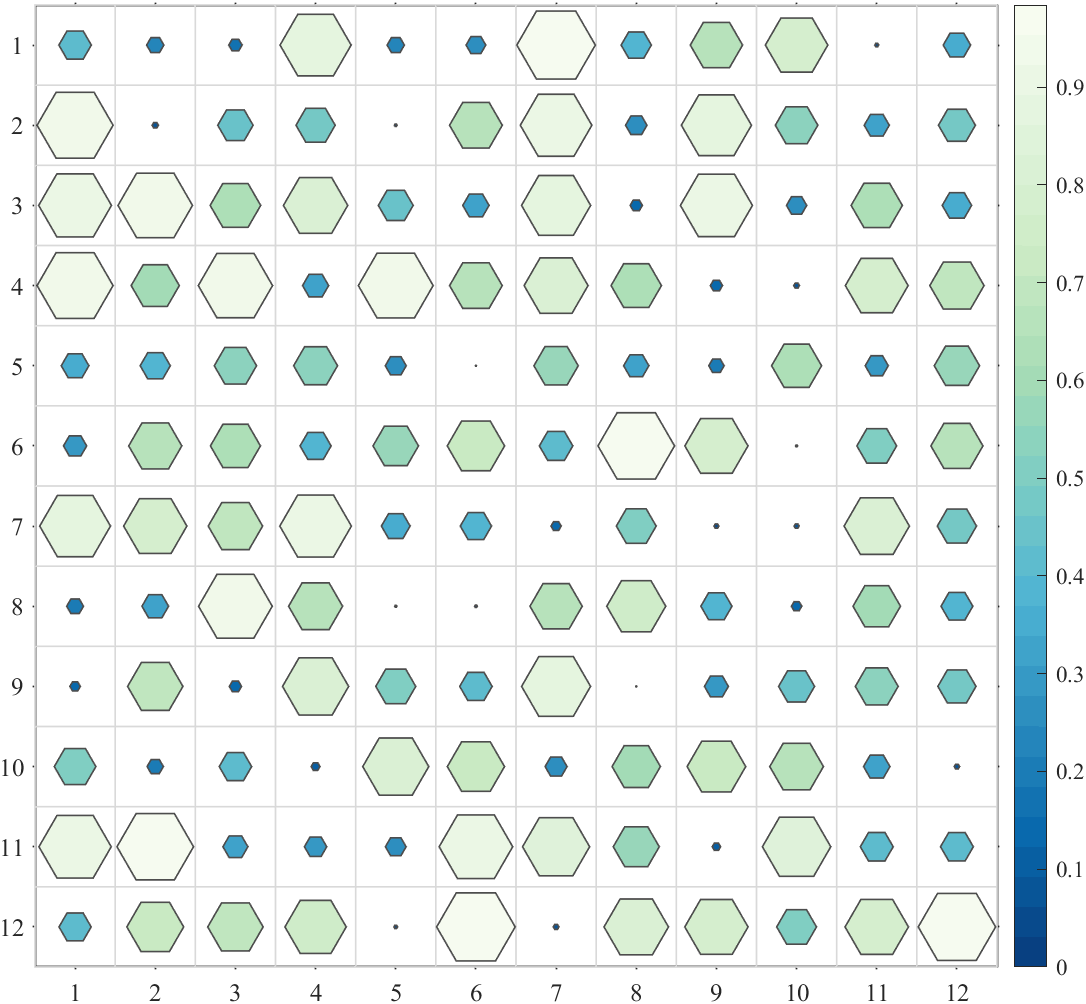
% sq    : square (default)   : 方形(默认)
% pie   : pie chart          : 饼图
% circ  : circular           : 圆形
% oval  : oval               : 椭圆形
% hex   : hexagon            :六边形
% asq   : auto-size square   :自带调整大小的方形
% acirc : auto-size circular :自带调整大小的圆形

Format={'sq','pie','circ','oval','hex','asq','acirc'};
A=rand(12,12);
B=rand(12,12)-.5;

for i=1:length(Format)
    % 绘制纯正数热图(Draw positive heat map)
    figure();
    SHM_A=SHeatmap(A,'Format',Format{i});
    SHM_A=SHM_A.draw();
    % exportgraphics(gca,['gallery\Format_',Type{i},'_A.png']) % 存储图片

    % 绘制含负数热图(Draw heat map with negative number)
    figure();
    SHM_B=SHeatmap(B,'Format',Format{i});
    SHM_B=SHM_B.draw();
    % exportgraphics(gca,['gallery\Format_',Type{i},'_B.png']) % 存储图片
end






%% 调整clim(Adjust clim)
% 使用 clim() 或者 caxis() 调整颜色映射范围
% Use function clim() or caxis() to set the CLim
fig=figure('Position',[50,50,1400,700]);
% random data
Data=rand(12,12)-.5;
Data([4,5,13])=nan;
% subplot1
ax1=axes('Parent',fig,'Position',[0+1/40,0,1/2-1/20,1]);
SHM_ax1=SHeatmap(Data,'Format','sq','Parent',ax1);
SHM_ax1=SHM_ax1.draw();
SHM_ax1.setText();
% subplot2 adjust clim
ax2=axes('Parent',fig,'Position',[1/2+1/40,0,1/2-1/20,1]);
SHM_ax2=SHeatmap(Data,'Format','sq','Parent',ax2);
SHM_ax2=SHM_ax2.draw();
clim([-.8,.8])
SHM_ax2.setText();
% exportgraphics(fig,'gallery\Colormap_clim.png')

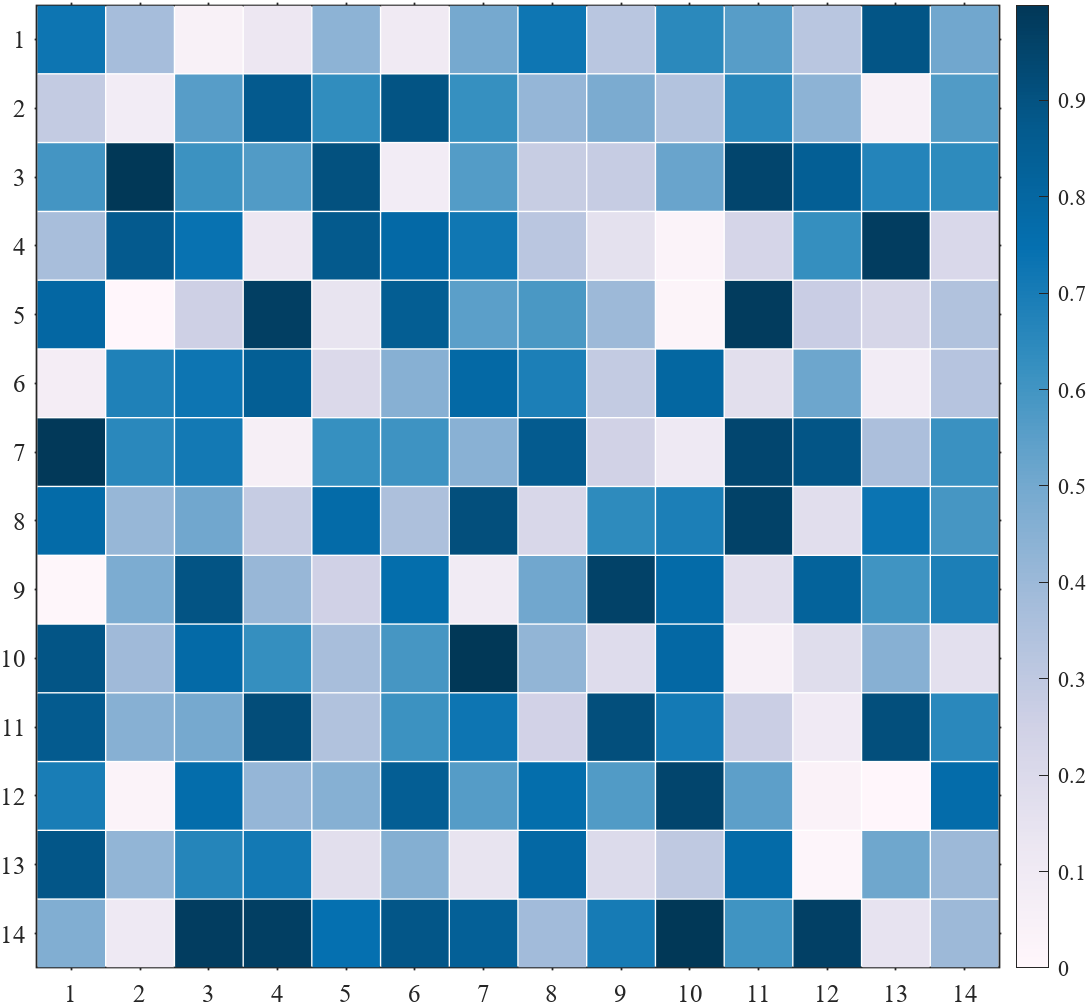
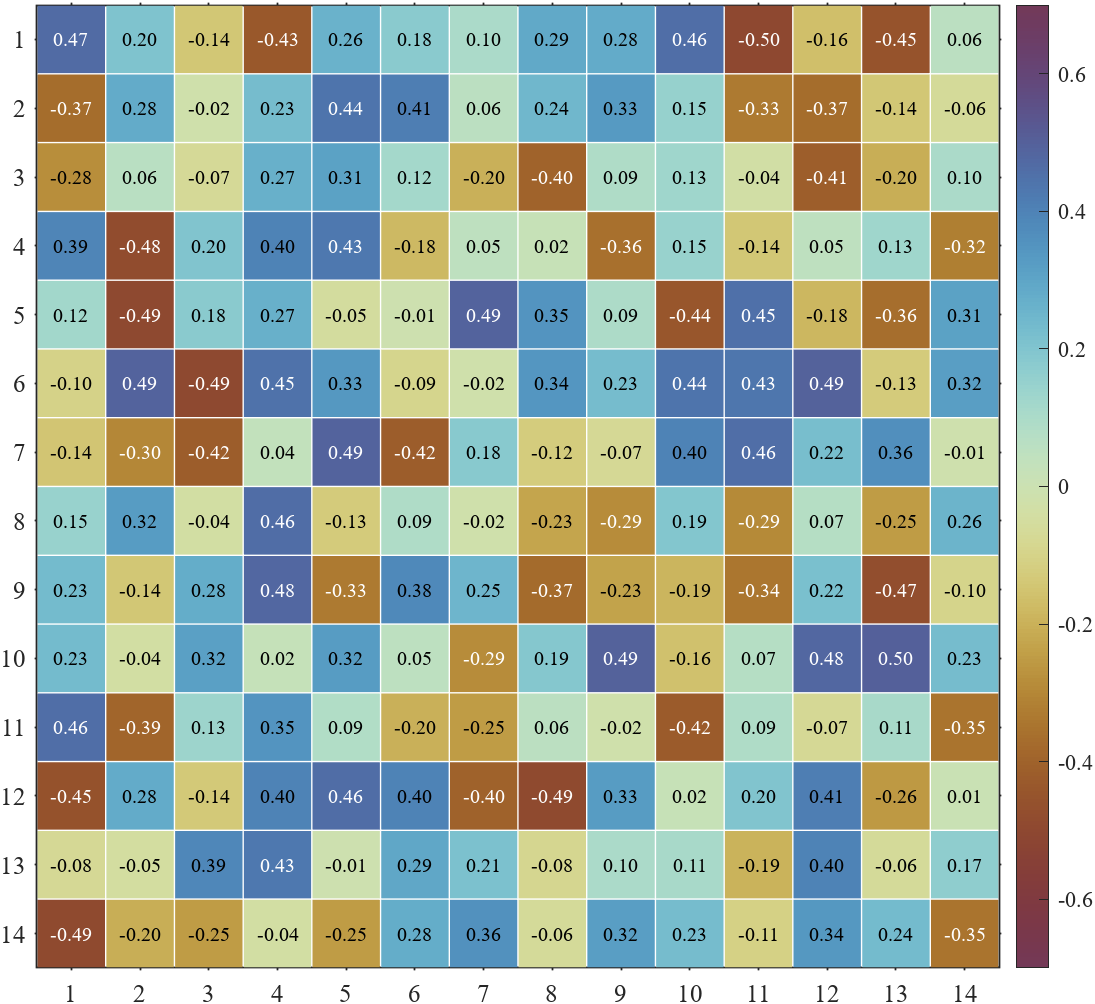
%% 使用MATLAB自带colormap(Use the built-in colormap in MATLAB)
figure()
Data=rand(14,14);
SHM_Bone=SHeatmap(Data,'Format','sq');
SHM_Bone.draw();
colormap(bone)
% exportgraphics(gca,'gallery\Colormap_bone.png')

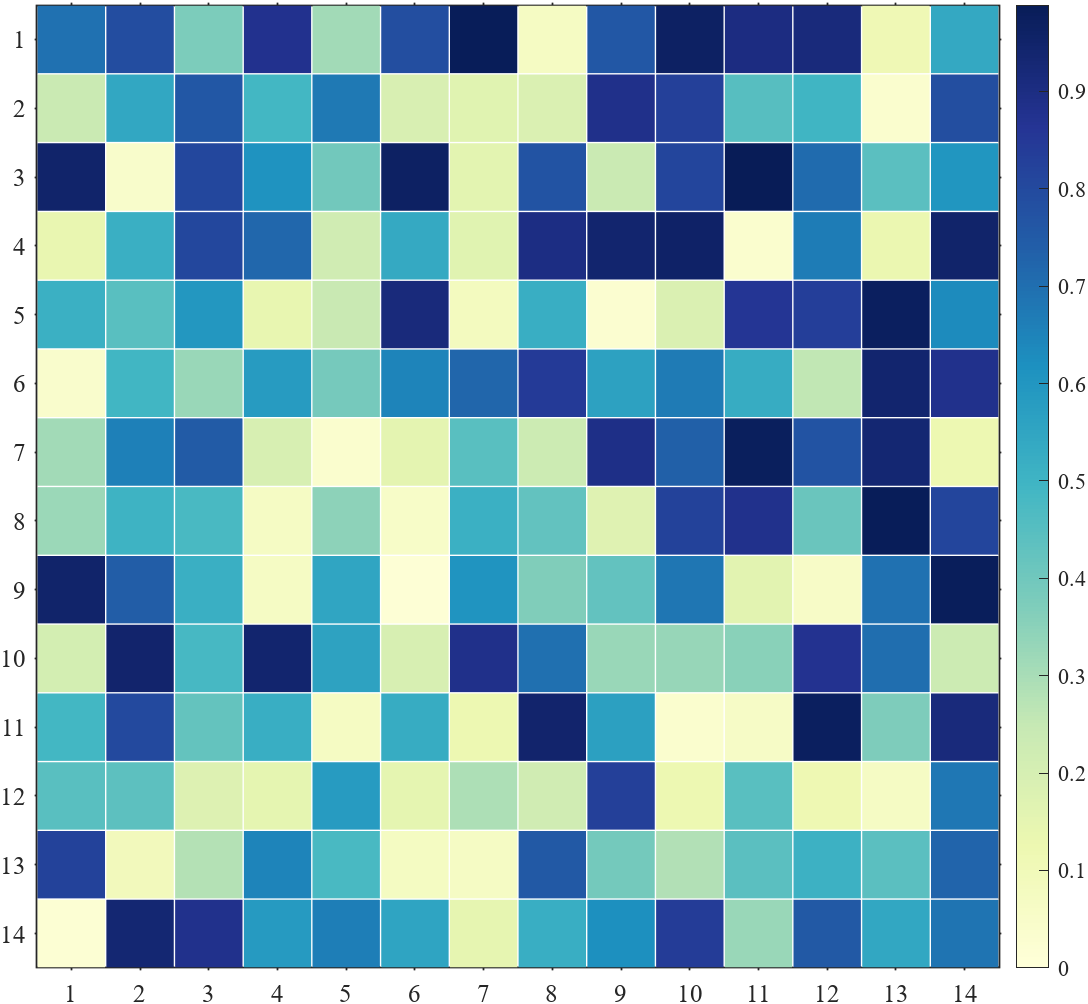
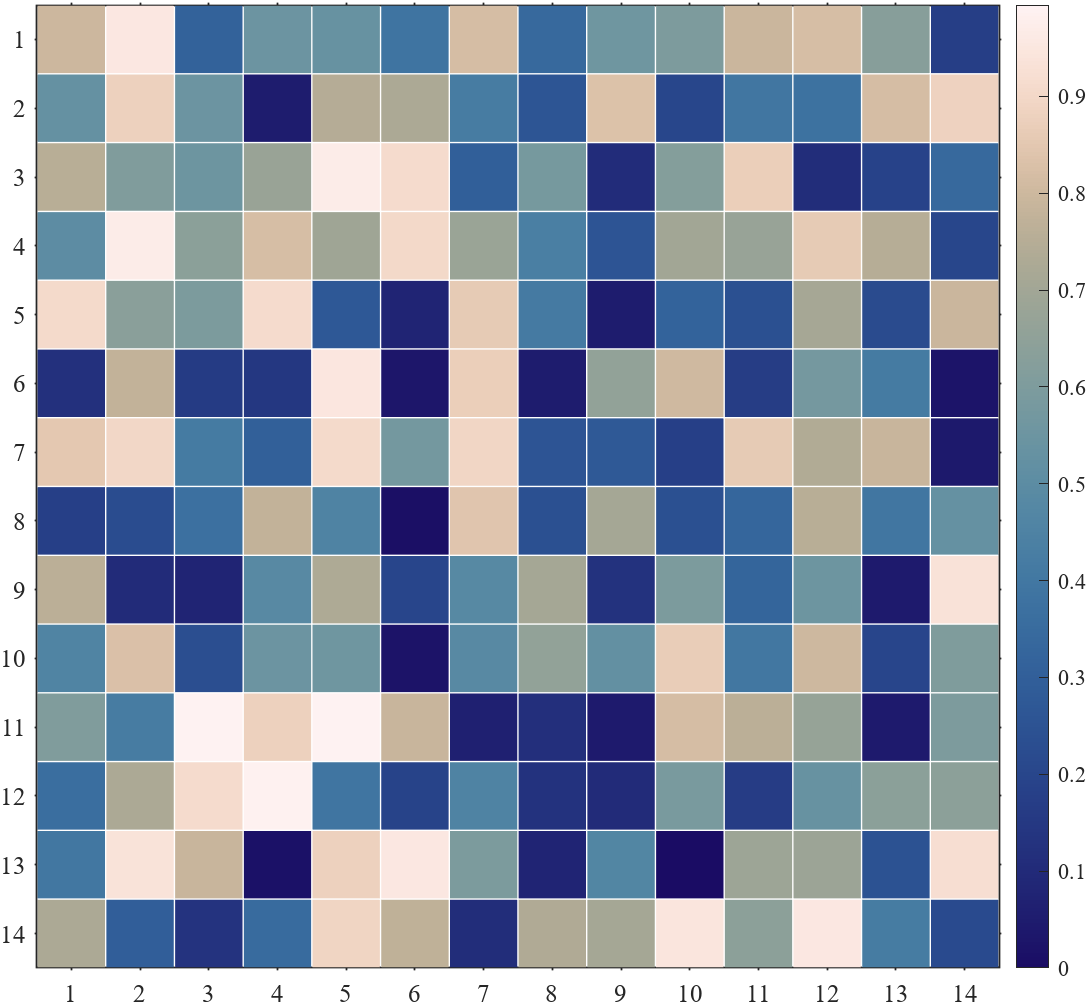
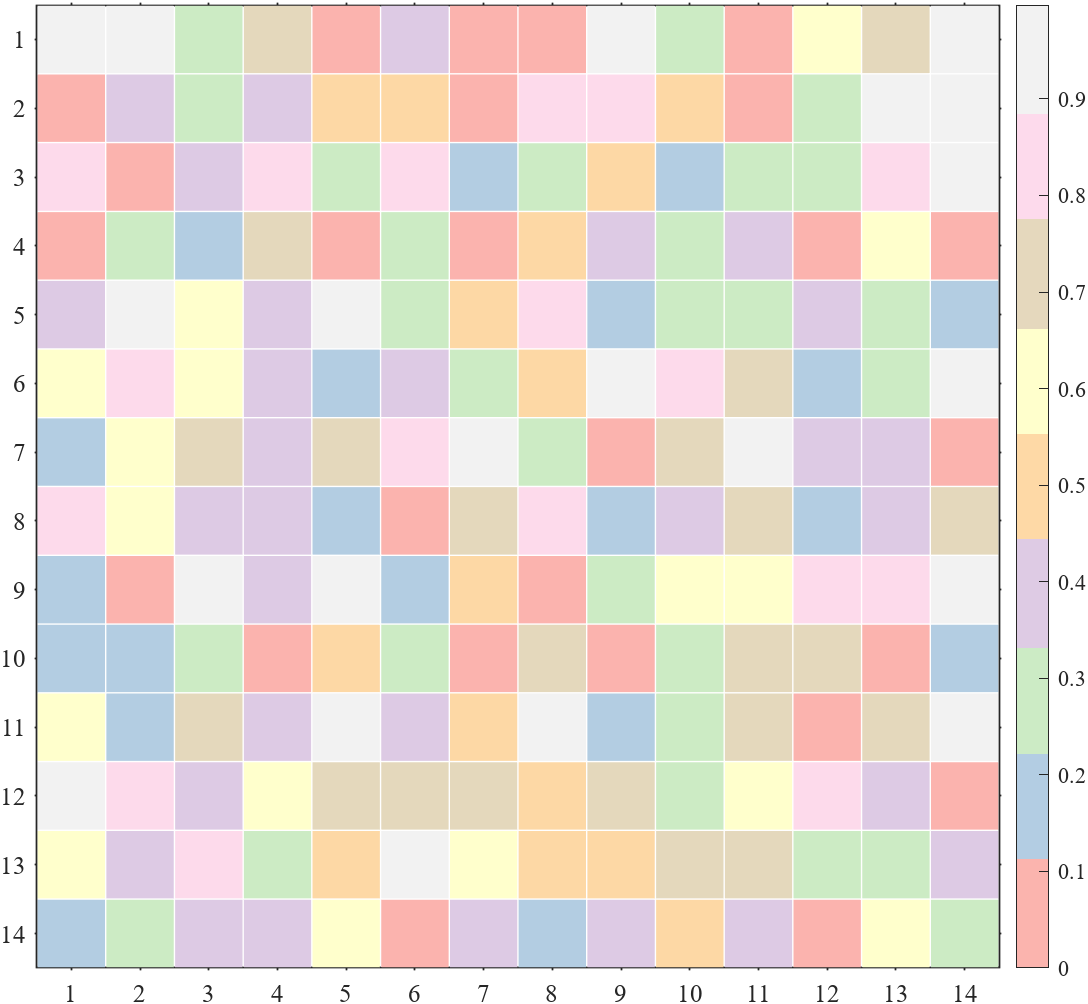
%% slanCM(slanCM colormap)
% Zhaoxu Liu / slandarer (2023). 200 colormap
% (https://www.mathworks.com/matlabcentral/fileexchange/120088-200-colormap),
% MATLAB Central File Exchange. 检索来源 2023/3/15.

% 单向colormap或离散colormap
for i=[20,21,61,177]
    figure()
    Data=rand(14,14);
    SHM_slan=SHeatmap(Data,'Format','sq');
    SHM_slan.draw();
    colormap(slanCM(i))
    exportgraphics(gca,['gallery\Colormap_slanCM_',num2str(i),'.png'])
end
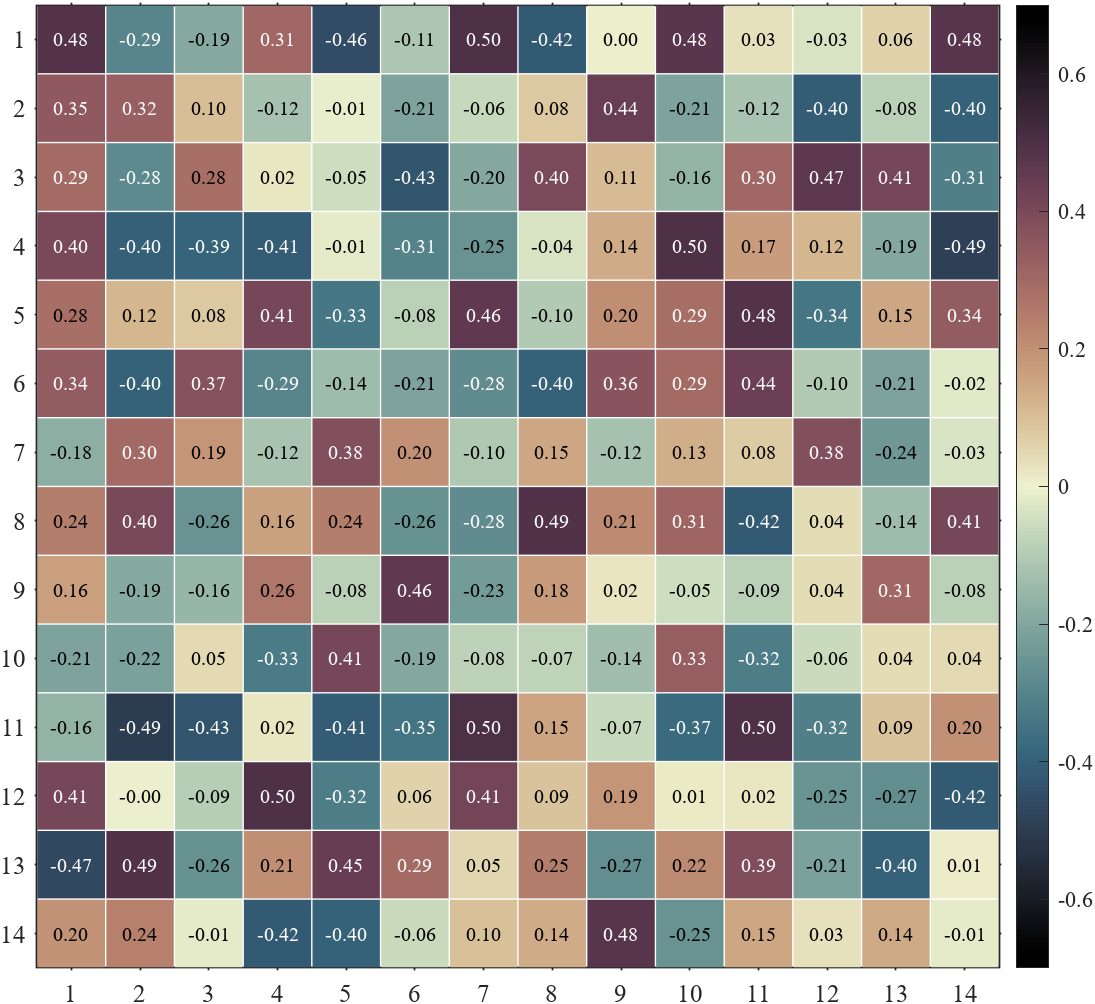
% 双向colormap(Diverging colormap)
for i=[141,136,134]
    figure()
    Data=rand(14,14)-.5;
    SHM_slan=SHeatmap(Data,'Format','sq');
    SHM_slan=SHM_slan.draw();
    clim([-.7,.7])
    colormap(slanCM(i))
    SHM_slan.setText();
    exportgraphics(gca,['gallery\Colormap_slanCM_',num2str(i),'.png'])
end
调整clim(Adjust clim)

使用MATLAB自带colormap(Use the built-in colormap in MATLAB)

slanCM(slanCM colormap)

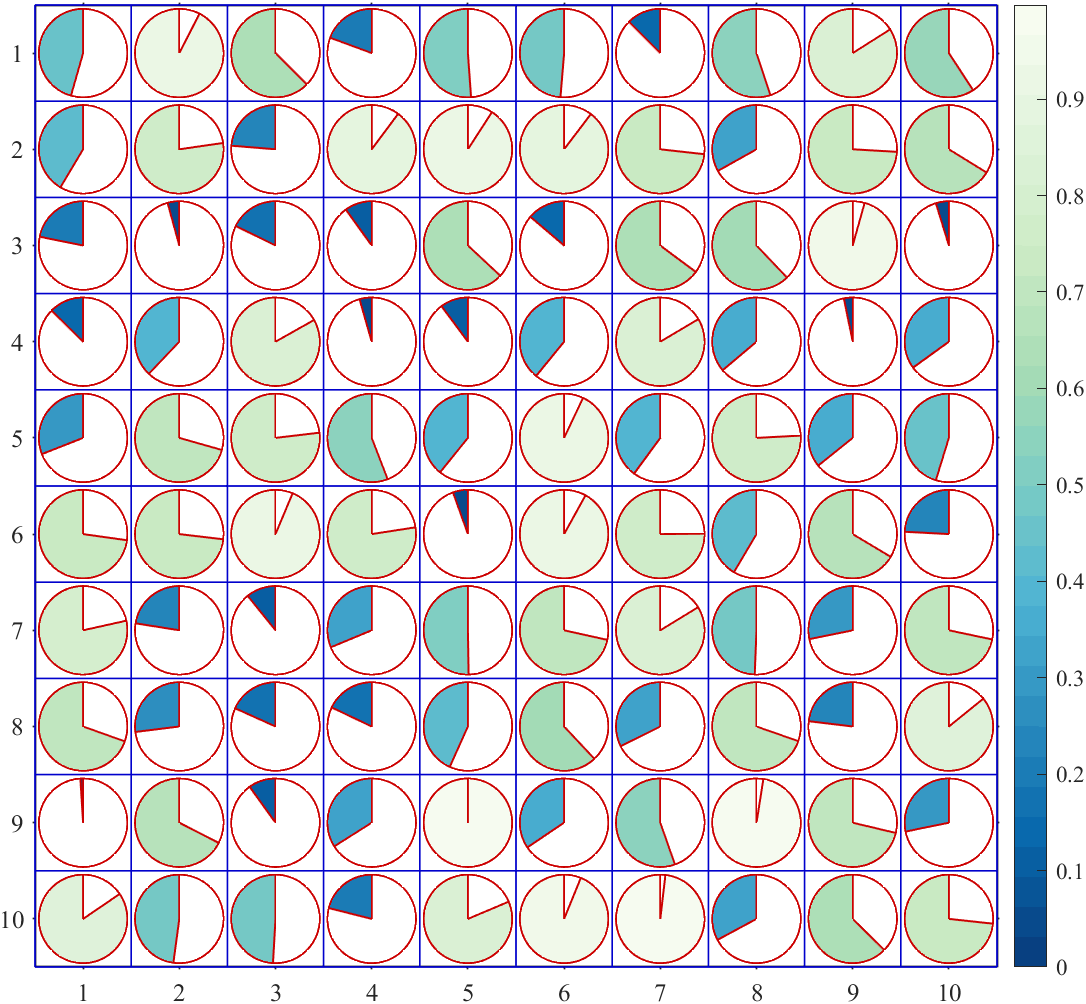
figure()
Data=rand(10,10);

SHM=SHeatmap(Data,'Format','pie');
SHM=SHM.draw();
% 容器边框设置为蓝色
% 图形边框设置为红色
% The container box border is set to blue
% The drawing border is set to red
SHM.setBox('Color',[0,0,.8])
SHM.setPatch('EdgeColor',[.8,0,0])


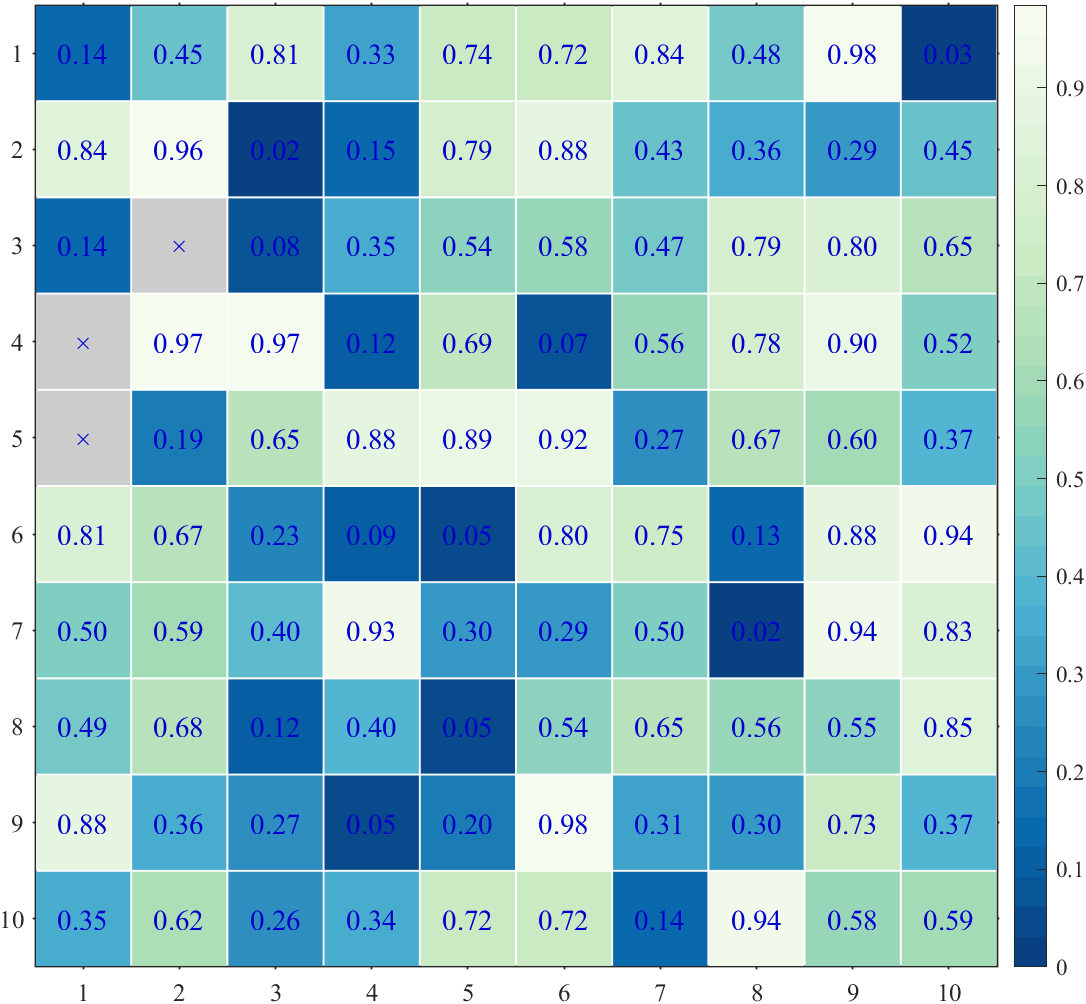
figure()
Data=rand(10,10);
Data([4,5,13])=nan;

SHM=SHeatmap(Data,'Format','sq');
SHM=SHM.draw();
% 设置文本为蓝色并修改字号
% Set the text to blue and modify the font size
SHM.setText('Color',[0,0,.8],'FontSize',14)
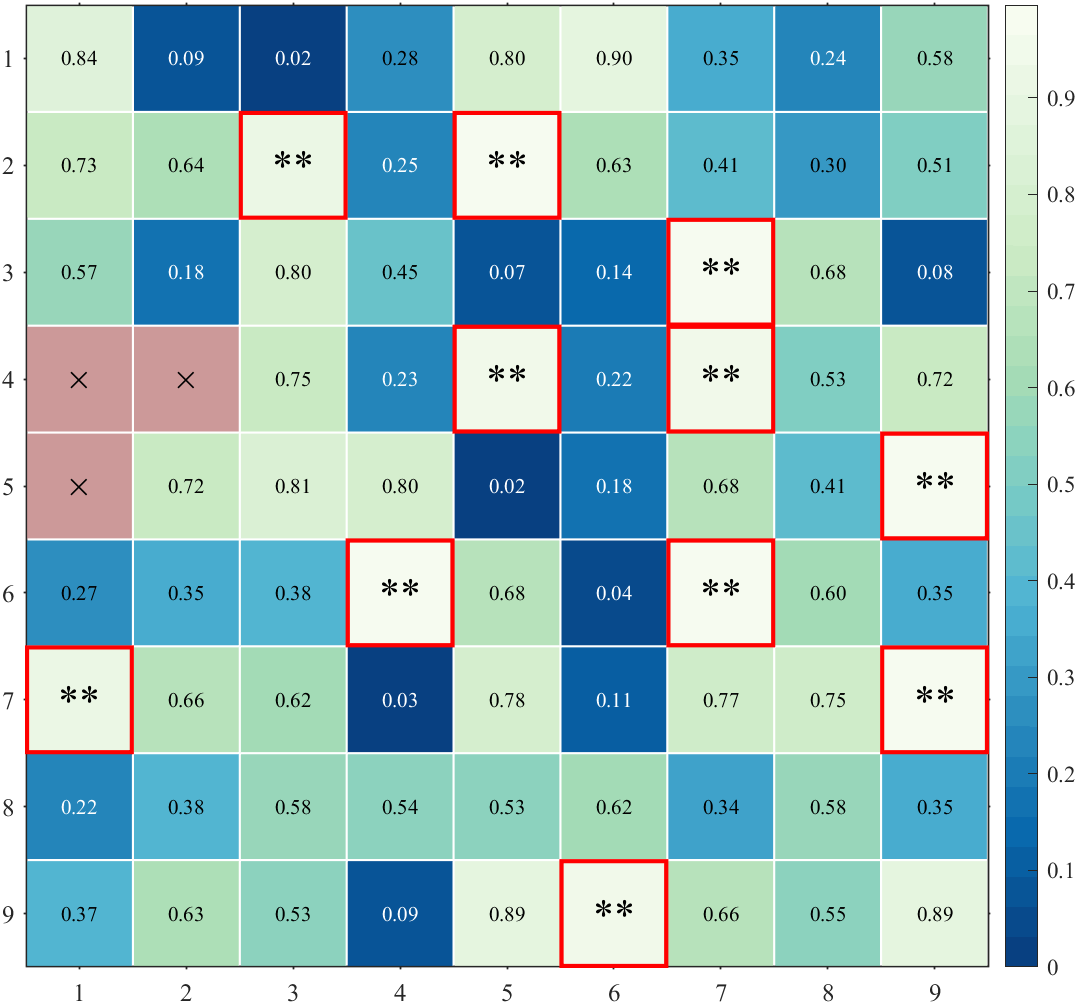
设置第m行n列对象的属性:举个例子,把数值大于0.9部分文字变为星号,并用红色框框起来,并改编NaN处颜色。
figure()
Data=rand(9,9);
Data([4,5,13])=nan;
% 绘制方块形状热图
SHM=SHeatmap(Data,'Format','sq');
SHM=SHM.draw();
% 显示文本(Show Text)
SHM.setText();
for i=1:size(Data,1)
    for j=1:size(Data,2)
        if Data(i,j)>=.9
            SHM.setTextMN(i,j,'String','**','FontSize',20)         % 修改>=0.9方块颜色
            SHM.setPatchMN(i,j,'EdgeColor',[1,0,0],'LineWidth',2)  % 修改>=0.9方块文本为**
        end
        if isnan(Data(i,j))
            SHM.setPatchMN(i,j,'FaceColor',[.8,.6,.6]) % 修改NaN处颜色
        end
    end
end
classdef SHeatmap
% =========================================================================
% Format
% -------------------------------------------------------------------------
% sq : square (default) : 方形(默认)
% pie : pie chart : 饼图
% circ : circular : 圆形
% oval : oval : 椭圆形
% hex : hexagon :六边形
% asq : auto-size square :自带调整大小的方形
% acirc : auto-size circular :自带调整大小的圆形
% =========================================================================
% @author : slandarer
% 公众号 : slandarer随笔
% -------------------------------------------------------------------------
% Zhaoxu Liu / slandarer (2023). special heatmap
% (https://www.mathworks.com/matlabcentral/fileexchange/125520-special-heatmap),
% MATLAB Central File Exchange. 检索来源 2023/3/1.
% -------------------------------------------------------------------------
properties
ax,arginList={'Format','Parent'}
Format='sq'
% sq : square (default) : 方形(默认)
% pie : pie chart : 饼图
% circ : circular : 圆形
% oval : oval : 椭圆形
% hex : hexagon :六边形
% asq : auto-size square :自带调整大小的方形
% acirc : auto-size circular :自带调整大小的圆形
Data
dfColor1=[0.9686 0.9882 0.9412; 0.9454 0.9791 0.9199; 0.9221 0.9700 0.8987; 0.8988 0.9609 0.8774;
0.8759 0.9519 0.8560; 0.8557 0.9438 0.8338; 0.8354 0.9357 0.8115; 0.8152 0.9276 0.7892;
0.7909 0.9180 0.7685; 0.7545 0.9039 0.7523; 0.7180 0.8897 0.7361; 0.6816 0.8755 0.7199;
0.6417 0.8602 0.7155; 0.5962 0.8430 0.7307; 0.5507 0.8258 0.7459; 0.5051 0.8086 0.7610;
0.4596 0.7873 0.7762; 0.4140 0.7620 0.7914; 0.3685 0.7367 0.8066; 0.3230 0.7114 0.8218;
0.2837 0.6773 0.8142; 0.2483 0.6378 0.7929; 0.2129 0.5984 0.7717; 0.1775 0.5589 0.7504;
0.1421 0.5217 0.7314; 0.1066 0.4853 0.7132; 0.0712 0.4488 0.6950; 0.0358 0.4124 0.6768;
0.0314 0.3724 0.6364; 0.0314 0.3319 0.5929; 0.0314 0.2915 0.5494; 0.0314 0.2510 0.5059]
dfColor2=[0.6196 0.0039 0.2588; 0.6892 0.0811 0.2753; 0.7588 0.1583 0.2917; 0.8283 0.2354 0.3082;
0.8706 0.2966 0.2961; 0.9098 0.3561 0.2810; 0.9490 0.4156 0.2658; 0.9660 0.4932 0.2931;
0.9774 0.5755 0.3311; 0.9887 0.6577 0.3690; 0.9930 0.7266 0.4176; 0.9943 0.7899 0.4707;
0.9956 0.8531 0.5238; 0.9968 0.9020 0.5846; 0.9981 0.9412 0.6503; 0.9994 0.9804 0.7161;
0.9842 0.9937 0.7244; 0.9526 0.9810 0.6750; 0.9209 0.9684 0.6257; 0.8721 0.9486 0.6022;
0.7975 0.9183 0.6173; 0.7228 0.8879 0.6325; 0.6444 0.8564 0.6435; 0.5571 0.8223 0.6448;
0.4698 0.7881 0.6460; 0.3868 0.7461 0.6531; 0.3211 0.6727 0.6835; 0.2553 0.5994 0.7139;
0.2016 0.5261 0.7378; 0.2573 0.4540 0.7036; 0.3130 0.3819 0.6694; 0.3686 0.3098 0.6353]
Colormap;maxV;Parent=[];
patchHdl;boxHdl;pieHdl;textHdl
% 修改为上下三角
Type='Full';VarName;RLabelHdl;CLabelHdl
end
methods
function obj=SHeatmap(Data,varargin)
obj.Data=Data;
obj.maxV=max(max(abs(obj.Data)));
% 获取其他数据
for i=1:2:(length(varargin)-1)
tid=ismember(obj.arginList,varargin{i});
if any(tid)
obj.(obj.arginList{tid})=varargin{i+1};
end
end
% 设置配色
if any(any(obj.Data<0))
obj.Colormap=obj.dfColor2;
% tX=linspace(0,1,size(obj.Colormap,1));
% tXi=linspace(0,1,256);
% tR=interp1(tX,obj.Colormap(:,1),tXi);
% tG=interp1(tX,obj.Colormap(:,2),tXi);
% tB=interp1(tX,obj.Colormap(:,3),tXi);
% obj.Colormap=[tR(:),tG(:),tB(:)];
else
obj.Colormap=obj.dfColor1(end:-1:1,:);
end
end
function obj=draw(obj)
if isempty(obj.Parent)
obj.ax=gca;
else
obj.ax=obj.Parent;
end
obj.ax.NextPlot='add';
obj.ax.Box='on';
obj.ax.FontName='Times New Roman';
obj.ax.FontSize=12;
obj.ax.LineWidth=.8;
obj.ax.XLim=[.5,size(obj.Data,2)+.5];
obj.ax.YLim=[.5,size(obj.Data,1)+.5];
obj.ax.YDir='reverse';
obj.ax.TickDir='out';
obj.ax.TickLength=[0.002,0.002];
obj.ax.DataAspectRatio=[1,1,1];
obj.ax.YTick=1:size(obj.Data,1);
obj.ax.XTick=1:size(obj.Data,2);
colormap(obj.ax,obj.Colormap)
colorbar(obj.ax)
if any(any(obj.Data<0))
try caxis(obj.ax,obj.maxV.*[-1,1]),catch,end
try clim(obj.ax,obj.maxV.*[-1,1]),catch,end
else
try caxis(obj.ax,obj.maxV.*[0,1]),catch,end
try clim(obj.ax,obj.maxV.*[0,1]),catch,end
end
% 调整初始界面大小
fig=obj.ax.Parent;
fig.Color=[1,1,1];
if max(fig.Position(3:4))<600
fig.Position(3:4)=[1.6,1.8].*fig.Position(3:4);
fig.Position(1:2)=fig.Position(1:2)./4;
end
bX1=repmat([.5,size(obj.Data,2)+.5,nan],[size(obj.Data,1)+1,1])';
bY1=repmat((.5:1:(size(obj.Data,1)+.5))',[1,3])';
bX2=repmat((.5:1:(size(obj.Data,2)+.5))',[1,3])';
bY2=repmat([.5,size(obj.Data,1)+.5,nan],[size(obj.Data,2)+1,1])';
obj.boxHdl=plot(obj.ax,[bX1(:);bX2(:)],[bY1(:);bY2(:)],'LineWidth',.8,'Color',[1,1,1].*.85);
if isequal(obj.Format,'sq')
set(obj.boxHdl,'Color',[1,1,1,0])
end
disp(char([64 97 117 116 104 111 114 32 58 32,...
115 108 97 110 100 97 114 101 114]))
baseT=linspace(0,2*pi,200);
hexT=linspace(0,2*pi,7);
thetaMat=[1,-1;1,1].*sqrt(2)./2;
for row=1:size(obj.Data,1)
for col=1:size(obj.Data,2)
if isnan(obj.Data(row,col))
obj.patchHdl(row,col)=fill(obj.ax,[-.5,.5,.5,-.5].*.98+col,[-.5,-.5,.5,.5].*.98+row,[.8,.8,.8],'EdgeColor','none');
obj.pieHdl(row,col)=fill(obj.ax,[0,0,0,0],[0,0,0,0],[0,0,0]);
obj.textHdl(row,col)=text(obj.ax,col,row,'×','FontName','Times New Roman','HorizontalAlignment','center','FontSize',20);
else
tRatio=abs(obj.Data(row,col))./obj.maxV;
switch obj.Format
case 'sq'
obj.patchHdl(row,col)=fill(obj.ax,[-.5,.5,.5,-.5].*.98+col,[-.5,-.5,.5,.5].*.98+row,...
obj.Data(row,col),'EdgeColor','none');
case 'asq'
obj.patchHdl(row,col)=fill(obj.ax,[-.5,.5,.5,-.5].*.98.*tRatio+col,[-.5,-.5,.5,.5].*.98.*tRatio+row,...
obj.Data(row,col),'EdgeColor','none');
case 'pie'
baseCircX=cos(baseT).*.92.*.5;
baseCircY=sin(baseT).*.92.*.5;
obj.pieHdl(row,col)=fill(obj.ax,baseCircX+col,baseCircY+row,...
[1,1,1],'EdgeColor',[1,1,1].*.3,'LineWidth',.8);
baseTheta=linspace(pi/2,pi/2+obj.Data(row,col)./obj.maxV.*2.*pi,200);
basePieX=[0,cos(baseTheta).*.92.*.5];
basePieY=[0,sin(baseTheta).*.92.*.5];
obj.patchHdl(row,col)=fill(obj.ax,basePieX+col,-basePieY+row,...
obj.Data(row,col),'EdgeColor',[1,1,1].*.3,'lineWidth',.8);
case 'circ'
baseCircX=cos(baseT).*.92.*.5;
baseCircY=sin(baseT).*.92.*.5;
obj.patchHdl(row,col)=fill(obj.ax,baseCircX+col,baseCircY+row,...
obj.Data(row,col),'EdgeColor','none','lineWidth',.8);
case 'acirc'
baseCircX=cos(baseT).*.92.*.5;
baseCircY=sin(baseT).*.92.*.5;
obj.patchHdl(row,col)=fill(obj.ax,baseCircX.*tRatio+col,baseCircY.*tRatio+row,...
obj.Data(row,col),'EdgeColor','none','lineWidth',.8);
case 'oval'
tValue=obj.Data(row,col)./obj.maxV;
baseA=1+(tValue<=0).*tValue;
baseB=1-(tValue>=0).*tValue;
baseOvalX=cos(baseT).*.98.*.5.*baseA;
baseOvalY=sin(baseT).*.98.*.5.*baseB;
baseOvalXY=thetaMat*[baseOvalX;baseOvalY];
obj.patchHdl(row,col)=fill(obj.ax,baseOvalXY(1,:)+col,-baseOvalXY(2,:)+row,...
obj.Data(row,col),'EdgeColor',[1,1,1].*.3,'lineWidth',.8);
case 'hex'
obj.patchHdl(row,col)=fill(obj.ax,cos(hexT).*.5.*.98.*tRatio+col,sin(hexT).*.5.*.98.*tRatio+row,...
obj.Data(row,col),'EdgeColor',[1,1,1].*.3,'lineWidth',.8);
end
obj.textHdl(row,col)=text(obj.ax,col,row,sprintf('%.2f',obj.Data(row,col)),'FontName','Times New Roman','HorizontalAlignment','center','Visible','off');
end
end
end
% -------------------------------------------------------------
for i=1:length(obj.Data)
obj.VarName{i}=['Var-',num2str(i)];
end
for row=1:size(obj.Data,1)
obj.RLabelHdl(row)=text(obj.ax,.5-.25,row,...
obj.VarName{row},'HorizontalAlignment','right',...
'FontName','Cambria','FontSize',12,'Visible','off');
end
for col=1:size(obj.Data,2)
obj.CLabelHdl(col)=text(obj.ax,col,.5-.25,...
obj.VarName{col},'HorizontalAlignment','left',...
'FontName','Cambria','FontSize',12,'Rotation',30,'Visible','off');
end
end
% 修饰文本
function setText(obj,varargin)
graymap=mean(get(obj.ax,'Colormap'),2);
climit=get(obj.ax,'CLim');
for row=1:size(obj.Data,1)
for col=1:size(obj.Data,2)
set(obj.textHdl(row,col),'Visible','on','Color',...
[1,1,1].*(interp1(linspace(climit(1),climit(2),size(graymap,1)),graymap,obj.Data(row,col))<.5),varargin{:})
end
end
switch obj.Type
case 'triu'
for row=1:size(obj.Data,1)
for col=1:(row-1)
set(obj.textHdl(row,col),'Visible','off')
end
end
case 'tril'
for col=1:size(obj.Data,2)
for row=1:(col-1)
set(obj.textHdl(row,col),'Visible','off')
end
end
case 'triu0'
for row=1:size(obj.Data,1)
for col=1:(row)
set(obj.textHdl(row,col),'Visible','off')
end
end
case 'tril0'
for col=1:size(obj.Data,2)
for row=1:(col)
set(obj.textHdl(row,col),'Visible','off')
end
end
end
end
function setTextMN(obj,m,n,varargin)
set(obj.textHdl(m,n),varargin{:})
end
% 设置图形样式
function setPatch(obj,varargin)
for row=1:size(obj.Data,1)
for col=1:size(obj.Data,2)
if ~isnan(obj.Data(row,col))
set(obj.patchHdl(row,col),varargin{:})
if isequal(obj.Format,'pie')
set(obj.pieHdl(row,col),varargin{:})
end
end
end
end
end
function setPatchMN(obj,m,n,varargin)
set(obj.patchHdl(m,n),varargin{:})
if isequal(obj.Format,'pie')
set(obj.pieHdl(m,n),varargin{:})
end
end
% 设置框样式
function setBox(obj,varargin)
set(obj.boxHdl,varargin{:})
end
% 调整上下三角
function obj=setType(obj,Type)
if size(obj.Data,1)==size(obj.Data,2)
obj.Type=Type;
obj.ax.XColor='none';
obj.ax.YColor='none';
obj.ax.YAxisLocation='right';
% obj.ax.YTickLabel='slandarer';
bX1=repmat([.5,size(obj.Data,2)+.5,nan],[size(obj.Data,1)+1,1])';
bY1=repmat((.5:1:(size(obj.Data,1)+.5))',[1,3])';
bX2=repmat((.5:1:(size(obj.Data,2)+.5))',[1,3])';
bY2=repmat([.5,size(obj.Data,1)+.5,nan],[size(obj.Data,2)+1,1])';
for n=1:size(obj.Data,1)
set(obj.RLabelHdl(n),'Visible','on');
set(obj.CLabelHdl(n),'Visible','on');
end
switch obj.Type
case 'triu'
for row=1:size(obj.Data,1)
for col=1:(row-1)
set(obj.patchHdl(row,col),'Visible','off')
set(obj.textHdl(row,col),'Visible','off')
if isequal(obj.Format,'pie')
set(obj.pieHdl(row,col),'Visible','off')
end
end
end
bX1(1,2:end)=bX1(1,2:end)+(0:size(obj.Data,1)-1);
bY2(2,:)=[1.5:1:(size(obj.Data,1)+.5),(size(obj.Data,1)+.5)];
set(obj.boxHdl,'XData',[bX1(:);bX2(:)],'YData',[bY1(:);bY2(:)])
for n=1:size(obj.Data,1)
set(obj.RLabelHdl(n),'Position',[.25-1+n,n,0]);
set(obj.CLabelHdl(n),'Position',[n,.25,0]);
end
case 'tril'
for col=1:size(obj.Data,2)
for row=1:(col-1)
set(obj.patchHdl(row,col),'Visible','off')
set(obj.textHdl(row,col),'Visible','off')
if isequal(obj.Format,'pie')
set(obj.pieHdl(row,col),'Visible','off')
end
end
end
bX1(2,1:end-1)=bX1(2,1:end-1)-(size(obj.Data,1)-1:-1:0);
bY2(1,:)=[.5,.5:1:(size(obj.Data,1)-.5)];
set(obj.boxHdl,'XData',[bX1(:);bX2(:)],'YData',[bY1(:);bY2(:)])
for n=1:size(obj.Data,1)
set(obj.RLabelHdl(n),'Position',[.25,n,0]);
set(obj.CLabelHdl(n),'Position',[n,.25-1+n,0]);
end
case 'triu0'
for row=1:size(obj.Data,1)
for col=1:(row)
set(obj.patchHdl(row,col),'Visible','off')
set(obj.textHdl(row,col),'Visible','off')
if isequal(obj.Format,'pie')
set(obj.pieHdl(row,col),'Visible','off')
end
end
end
bX1(1,:)=bX1(1,:)+1;
bX1(1,2:end)=bX1(1,2:end)+(0:size(obj.Data,1)-1);
bY2(2,:)=[1.5:1:(size(obj.Data,1)+.5),(size(obj.Data,1)+.5)]-1;
set(obj.boxHdl,'XData',[bX1(:);bX2(:)],'YData',[bY1(:);bY2(:)])
for n=1:size(obj.Data,1)
set(obj.RLabelHdl(n),'Position',[.25+n,n,0]);
set(obj.CLabelHdl(n),'Position',[n,.25,0]);
end
set(obj.CLabelHdl(1),'Visible','off');
set(obj.RLabelHdl(size(obj.Data,1)),'Visible','off');
case 'tril0'
for col=1:size(obj.Data,2)
for row=1:(col)
set(obj.patchHdl(row,col),'Visible','off')
set(obj.textHdl(row,col),'Visible','off')
if isequal(obj.Format,'pie')
set(obj.pieHdl(row,col),'Visible','off')
end
end
end
bX1(2,:)=bX1(2,:)-1;
bX1(2,1:end-1)=bX1(2,1:end-1)-(size(obj.Data,1)-1:-1:0);
bY2(1,:)=[.5,.5:1:(size(obj.Data,1)-.5)]+1;
set(obj.boxHdl,'XData',[bX1(:);bX2(:)],'YData',[bY1(:);bY2(:)])
for n=1:size(obj.Data,1)
set(obj.RLabelHdl(n),'Position',[.25,n,0]);
set(obj.CLabelHdl(n),'Position',[n,.25+n,0]);
end
set(obj.RLabelHdl(1),'Visible','off');
set(obj.CLabelHdl(size(obj.Data,1)),'Visible','off');
end
end
end
% 设置变量标签
function setVarName(obj,VarName)
obj.VarName=VarName;VarNameLen=length(obj.VarName);
for n=1:size(obj.Data,1)
set(obj.RLabelHdl(n),'String',obj.VarName{mod(n-1,VarNameLen)+1})
set(obj.CLabelHdl(n),'String',obj.VarName{mod(n-1,VarNameLen)+1})
end
end
function setRowLabel(obj,varargin)
for n=1:size(obj.Data,1)
set(obj.RLabelHdl(n),varargin{:})
end
end
function setColLabel(obj,varargin)
for n=1:size(obj.Data,2)
set(obj.CLabelHdl(n),varargin{:})
end
end
end
% =========================================================================
% @author : slandarer
% 公众号 : slandarer随笔
% -------------------------------------------------------------------------
% Zhaoxu Liu / slandarer (2023). special heatmap
% (https://www.mathworks.com/matlabcentral/fileexchange/125520-special-heatmap),
% MATLAB Central File Exchange. 检索来源 2023/3/1.
% -------------------------------------------------------------------------
end
function order=SDendrogram(Data,varargin)
% Zhaoxu Liu / slandarer (2023). special heatmap
% (https://www.mathworks.com/matlabcentral/fileexchange/125520-special-heatmap),
% MATLAB Central File Exchange. 检索来源 2023/3/1.
obj.arginList={'Orientation','Parent','Method'};
obj.Orientation='top';
% obj.MinLim=0;
obj.Parent=gca;
obj.DataLen=0;
obj.Method='average';
% 获取其他数据
for i=1:2:(length(varargin)-1)
    tid=ismember(obj.arginList,varargin{i});
    if any(tid)
        obj.(obj.arginList{tid})=varargin{i+1};
    end
end
figure();
if isequal(obj.Orientation,'top')
    tree=linkage(Data.',obj.Method);
else
    tree=linkage(Data,obj.Method);
end
[treeHdl,~,order]=dendrogram(tree,0,'Orientation',obj.Orientation);
set(treeHdl,'Color',[0,0,0]);
set(treeHdl,'LineWidth',.8);
tempFig=treeHdl(1).Parent.Parent;
% 坐标区域修饰
axTree=copyAxes(tempFig,1,obj.Parent);obj.Parent
axTree.XColor='none';
axTree.YColor='none';
axTree.XTick=[];
axTree.YTick=[];
axTree.NextPlot='add';
delete(tempFig);
switch obj.Orientation
    case 'top'
        obj.DataLen=size(Data,2);
        axTree.XLim=[1,obj.DataLen]+[-.5,.5];
    case 'left'
        obj.DataLen=size(Data,1);
        axTree.YDir='reverse';
        axTree.YLim=[1,obj.DataLen]+[-.5,.5];
end
% -------------------------------------------------------------------------
    function axbag=copyAxes(fig,k,newAx)
        % @author : slandarer
        % 公众号  : slandarer随笔
        % 知乎    : slandarer
        %
        % 此段代码解析详见公众号 slandarer随笔 文章:
        %《MATLAB | 如何复制figure图窗任意axes的全部信息?》
        % https://mp.weixin.qq.com/s/3i8C78pv6Ok1cmEZYPMyWg
        classList(length(fig.Children))=true;
        for n=1:length(fig.Children)
            classList(n)=isa(fig.Children(n),'matlab.graphics.axis.Axes');
        end
        isaaxes=find(classList);
        oriAx=fig.Children(isaaxes(end-k+1));
        if isaaxes(end-k+1)-1<1||isa(fig.Children(isaaxes(end-k+1)-1),'matlab.graphics.axis.Axes')
            oriLgd=[];
        else
            oriLgd=fig.Children(isaaxes(end-k+1)-1);
        end
        axbag=copyobj([oriAx,oriLgd],newAx.Parent);
        axbag(1).Position=newAx.Position;
        delete(newAx)
    end
end
function [X,Y]=SClusterBlock(Class,varargin)
% Zhaoxu Liu / slandarer (2023). special heatmap
% (https://www.mathworks.com/matlabcentral/fileexchange/125520-special-heatmap),
% MATLAB Central File Exchange. 检索来源 2023/3/1.
obj.arginList={'Orientation','MinLim','Parent','ColorList','BlockProp'};
obj.Orientation='top';
obj.MinLim=0;
obj.Parent=gca;
obj.BlockProp={'LineWidth',.8};
obj.ColorList=...
    [0.5529    0.8275    0.7804
    1.0000    1.0000    0.7020
    0.7451    0.7294    0.8549
    0.9843    0.5020    0.4471
    0.5020    0.6941    0.8275
    0.9922    0.7059    0.3843
    0.7020    0.8706    0.4118
    0.9882    0.8039    0.8980
    0.8510    0.8510    0.8510
    0.7373    0.5020    0.7412
    0.8000    0.9216    0.7725
    1.0000    0.9294    0.4353];
obj.ColorList=[obj.ColorList;rand(max(Class),3)./5+.5];
% 获取其他数据
for i=1:2:(length(varargin)-1)
    tid=ismember(obj.arginList,varargin{i});
    if any(tid)
        obj.(obj.arginList{tid})=varargin{i+1};
    end
end
obj.Parent.XColor='none';
obj.Parent.YColor='none';
obj.Parent.XTick=[];
obj.Parent.YTick=[];
obj.Parent.NextPlot='add';
Class=Class(:).';
CCList=[0,find([diff(Class),1]~=0)];
if isequal(obj.Orientation,'top')
    X=zeros([1,length(CCList)-1]);
    Y=ones([1,length(CCList)-1]).*(obj.MinLim+.5);
else
    X=ones([1,length(CCList)-1]).*(obj.MinLim+.5);
    Y=zeros([1,length(CCList)-1]);
end
for i=1:length(CCList)-1
    CL=[CCList(i)+1,CCList(i+1)];

    if isequal(obj.Orientation,'top')
        fill(obj.Parent,CL([1,2,2,1])+[-.5,.5,.5,-.5],[obj.MinLim,obj.MinLim,obj.MinLim+1,obj.MinLim+1],...
            obj.ColorList(Class(CCList(i)+1),:),obj.BlockProp{:})
        X(i)=(CL(1)+CL(2))/2;
    else
        fill(obj.Parent,[obj.MinLim,obj.MinLim,obj.MinLim+1,obj.MinLim+1],CL([1,2,2,1])+[-.5,.5,.5,-.5],...
            obj.ColorList(Class(CCList(i)+1),:),obj.BlockProp{:})
        obj.Parent.YDir='reverse';
        Y(i)=(CL(1)+CL(2))/2;
    end
end
axis tight
end
编程不易,希望大家该点赞的点赞,该在看的在看!!
未经允许本代码请勿作商业用途,引用的话可以引用我file exchange上的链接,可使用如下格式:
Zhaoxu Liu / slandarer (2023). special heatmap (https://www.mathworks.com/matlabcentral/fileexchange/125520-special-heatmap), MATLAB Central File Exchange. 检索来源 2023/3/17.
gitee仓库:https://gitee.com/slandarer/matlab-special-heatmap
百度网盘:
链接:https://pan.baidu.com/s/13t5w0aVzCWebNwaFfWSlnw?pwd=slan
提取码:slan
matlab打开matlab,用最简单的imread方法读取一个图像clcclearimg_h=imread('hua.jpg');返回一个数组(矩阵),往往是a*b*cunit8类型解释一下这个三维数组的意思,行数、数和层数,unit8:指数据类型,无符号八位整形,可理解为0~2^8的数三个层数分别代表RGB三个通道图像rgb最常用的是24-位实现方法,即RGB每个通道有256色阶(2^8)。基于这样的24-位RGB模型的色彩空间可以表现256×256×256≈1670万色当imshow传入了一个二维数组,它将以灰度方式绘制;可以把图像拆分为rgb三层,可以以灰度的方式观察它figure(1
MIMO技术的优缺点优点通过下面三个增益来总体概括:阵列增益。阵列增益是指由于接收机通过对接收信号的相干合并而活得的平均SNR的提高。在发射机不知道信道信息的情况下,MIMO系统可以获得的阵列增益与接收天线数成正比复用增益。在采用空间复用方案的MIMO系统中,可以获得复用增益,即信道容量成倍增加。信道容量的增加与min(Nt,Nr)成正比分集增益。在采用空间分集方案的MIMO系统中,可以获得分集增益,即可靠性性能的改善。分集增益用独立衰落支路数来描述,即分集指数。在使用了空时编码的MIMO系统中,由于接收天线或发射天线之间的间距较远,可认为它们各自的大尺度衰落是相互独立的,因此分布式MIMO
我有一个使用SeleniumWebdriver和Nokogiri的Ruby应用程序。我想选择一个类,然后对于那个类对应的每个div,我想根据div的内容执行一个Action。例如,我正在解析以下页面:https://www.google.com/webhp?sourceid=chrome-instant&ion=1&espv=2&ie=UTF-8#q=puppies这是一个搜索结果页面,我正在寻找描述中包含“Adoption”一词的第一个结果。因此机器人应该寻找带有className:"result"的div,对于每个检查它的.descriptiondiv是否包含单词“adoption
我正在我的Rails项目中安装Grape以构建RESTfulAPI。现在一些端点的操作需要身份验证,而另一些则不需要身份验证。例如,我有users端点,看起来像这样:moduleBackendmoduleV1classUsers现在如您所见,除了password/forget之外的所有操作都需要用户登录/验证。创建一个新的端点也没有意义,比如passwords并且只是删除password/forget从逻辑上讲,这个端点应该与用户资源。问题是Grapebefore过滤器没有像except,only这样的选项,我可以在其中说对某些操作应用过滤器。您通常如何干净利落地处理这种情况?
在我做的一些网络开发中,我有多个操作开始,比如对外部API的GET请求,我希望它们同时开始,因为一个不依赖另一个的结果。我希望事情能够在后台运行。我找到了concurrent-rubylibrary这似乎运作良好。通过将其混合到您创建的类中,该类的方法具有在后台线程上运行的异步版本。这导致我编写如下代码,其中FirstAsyncWorker和SecondAsyncWorker是我编写的类,我在其中混合了Concurrent::Async模块,并编写了一个名为“work”的方法来发送HTTP请求:defindexop1_result=FirstAsyncWorker.new.async.
a=[3,4,7,8,3]b=[5,3,6,8,3]假设数组长度相同,是否有办法使用each或其他一些惯用方法从两个数组的每个元素中获取结果?不使用计数器?例如获取每个元素的乘积:[15,12,42,64,9](0..a.count-1).eachdo|i|太丑了...ruby1.9.3 最佳答案 使用Array.zip怎么样?:>>a=[3,4,7,8,3]=>[3,4,7,8,3]>>b=[5,3,6,8,3]=>[5,3,6,8,3]>>c=[]=>[]>>a.zip(b)do|i,j|c[[3,5],[4,3],[7,6],
我有一个非常简单的Controller来管理我的Rails应用程序中的静态页面:classPagesController我怎样才能让View模板返回它自己的名字,这样我就可以做这样的事情:#pricing.html.erb#-->"Pricing"感谢您的帮助。 最佳答案 4.3RoutingParametersTheparamshashwillalwayscontainthe:controllerand:actionkeys,butyoushouldusethemethodscontroller_nameandaction_nam
目录0专栏介绍1平面2R机器人概述2运动学建模2.1正运动学模型2.2逆运动学模型2.3机器人运动学仿真3动力学建模3.1计算动能3.2势能计算与动力学方程3.3动力学仿真0专栏介绍?附C++/Python/Matlab全套代码?课程设计、毕业设计、创新竞赛必备!详细介绍全局规划(图搜索、采样法、智能算法等);局部规划(DWA、APF等);曲线优化(贝塞尔曲线、B样条曲线等)。?详情:图解自动驾驶中的运动规划(MotionPlanning),附几十种规划算法1平面2R机器人概述如图1所示为本文的研究本体——平面2R机器人。对参数进行如下定义:机器人广义坐标
1、接口请求基本操作1.1例子tips在view的选项可以zoomin调整窗口字帖大小。1、创建一个测试的workspace,并命名为test2、test后面新增一个addrequest3、选择发送GET,URL为一个开源的https://api.apiopen.top/api/sentences获取每日一句4、点击send查看内容Tips:如果提示出现Error:tunnelingsocketcouldnotbeestablished,statusCode=407错误,参照以下解决办法)关于tunnelingsocketcouldnotbeestablished,cause=getaddri
一、机器人介绍 此处是基于MATLABRVC工具箱,对ABB-IRB-1200型号的微型机械臂进行正逆向运动学分析,并利Simulink工具实现对机械臂进行具有动力学参数的末端轨迹规划仿真,最后根据机械模型设计Simulink-Adams联合仿真。 图1.ABBIRB 1200尺寸参数示意图ABBIRB 1200提供的两种型号广泛适用于各作业,且两者间零部件通用,两种型号的工作范围分别为700 mm 和 900 mm,大有效负载分别为 7 kg 和5 kg。 IRB 1200 能够在狭小空间内能发挥其工作范围与性能优势,具有全新的设计、小型化的体积、高效的性能、易于集成、便捷的接
