代码在莺尾花数据集上训练SVM,数据集由莺尾花的测量值及其相应的物种标签组成。该模型使用70%数据用于训练,然后剩余部分进行测试。其中 ′ f i t ′ 'fit' ′fit′方法在训练集上训练数据, ′ s c o r e ′ 'score' ′score′数据在返回模型的测试数据上的准确性:
注:其实这篇文章完全由openAI的chatGPT完成,包括代码部分,这里我将生成的英文原意和中文翻译都进行展示
代码如下:
import numpy as np
from sklearn import datasets
from sklearn.svm import SVC
from sklearn.model_selection import train_test_split
import matplotlib.pyplot as plt

# Load the iris dataset
iris = datasets.load_iris()
X = iris["data"]
y = iris["target"]

# Split the data into training and test sets
X_train, X_test, y_train, y_test = train_test_split(X, y, test_size=0.3)

# Create the SVM model
model = SVC()

# Train the model on the training data
model.fit(X_train, y_train)

# Test the model on the test data
accuracy = model.score(X_test, y_test)

# Print the test accuracy
print("Test accuracy: {:.2f}".format(accuracy))

# Plot the data
fig, ax = plt.subplots()
colors = ["r", "g", "b"]
for i in range(3):
    indices = np.where(y == i)[0]
    ax.scatter(X[indices, 0], X[indices, 1], c=colors[i], label=iris["target_names"][i])
ax.legend()
plt.show()
import numpy as np
from sklearn import datasets
from sklearn.svm import SVC
from sklearn.model_selection import train_test_split
import matplotlib.pyplot as plt
在这些行中,我们导入必要的库。numpy是 Python 中用于科学计算的库,我们将使用它来存储和操作数据。datasets是scikit-learn库中的一个模块,其中包含许多可用于机器学习的数据集,我们将使用它来加载鸢尾花数据集。SVC是scikit-learn库中支持向量机 (SVM) 的类,我们将使用它来创建 SVM 模型。是我们将用于将数据拆分为训练集和测试集的模块中的train_test_split一个函数。最后,是库中的一个模块,我们将使用它来绘制数据。model_selection,scikit-learn,pyplot,matplotlib
# Load the iris dataset
iris = datasets.load_iris()
X = iris["data"]
y = iris["target"]
在这些行中,我们从模块加载 iris 数据集datasets并将其存储在一个名为iris. 鸢尾花数据集是一个类似字典的对象,其中包含数据和数据标签。我们将数据存储在一个名为 的变量X中,将标签存储在一个名为 的变量中y。数据由每个样本的四个特征(萼片长度、萼片宽度、花瓣长度和花瓣宽度)组成,标签是对应的鸢尾属植物属性
# Split the data into training and test sets
X_train, X_test, y_train, y_test = train_test_split(X, y, test_size=0.3)
在这一行中,我们使用该train_test_split函数将数据和标签拆分为训练集和测试集。该test_size参数指定应该用于测试的数据部分。在这种情况下,我们使用 30% 的数据进行测试,70% 的数据用于训练。该函数返回四个数组:X_trainandy_train包含训练数据和标签,X_test和y_test包含测试数据和标签。
# Create the SVM model
model = SVC()
SVC在这一行中,我们使用该类创建一个 SVM 模型。我们不需要指定任何参数,因此我们可以像调用函数一样简单地创建类的实例
# Train the model on the training data
model.fit(X_train, y_train)
在这一行中,我们使用对象的fit方法model在训练数据上训练模型。该方法有两个参数:数据和标签。
# Test the model on the test data
accuracy = model.score(X_test, y_test)

# Print the test accuracy
print("Test accuracy: {:.2f}".format(accuracy))
在这些行中,我们使用对象的score方法model来评估模型在测试数据上的准确性。该方法有两个参数:测试数据和测试标签。它返回一个介于 0 和 1 之间的浮点数,其中 1 表示完美的精度。我们使用字符串格式将准确性打印到控制台。
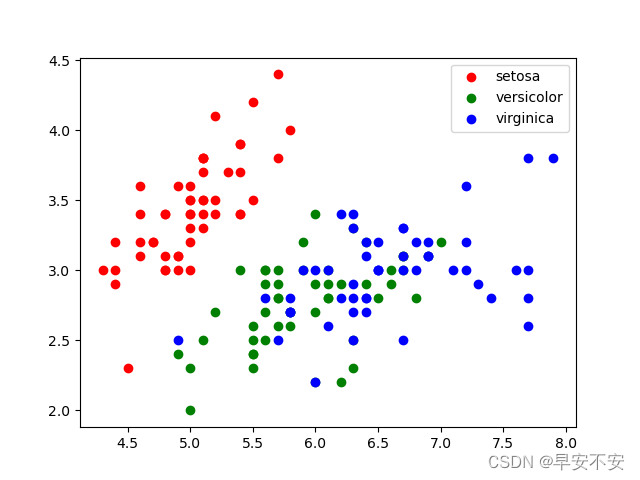
# Plot the data
fig, ax = plt.subplots()
colors = ["r", "g", "b"]
for i in range(3):
    indices = np.where(y == i)[0]
    ax.scatter(X[indices, 0], X[indices, 1], c=colors[i], label=iris["target_names"][i])
ax.legend()
plt.show()
在这些行中,我们使用subplots函数 frommatplotlib创建一个图形和一个轴对象,然后我们使用scatter轴对象的方法绘制数据。我们遍历三种鸢尾,对于每个物种,我们使用where函数 from选择具有相应标签的样本numpy。然后我们使用该方法绘制这些样本scatter,其中萼片长度为 x 轴,萼片宽度为 y 轴。我们为每个物种使用不同的颜色,并使用该legend方法向图中添加图例。最后,我们使用show函数来显示绘图。
Certainly! Here is a more detailed explanation of the code:
import numpy as np
from sklearn import datasets
from sklearn.svm import SVC
from sklearn.model_selection import train_test_split
import matplotlib.pyplot as plt
In these lines, we import the necessary libraries. numpy is a library for scientific computing in Python, and we will use it to store and manipulate the data. datasets is a module from the scikit-learn library that contains a number of datasets that can be used for machine learning, and we will use it to load the iris dataset. SVC is a class for support vector machines (SVMs) in the scikit-learn library, and we will use it to create an SVM model. train_test_split is a function from the model_selection module of scikit-learn that we will use to split the data into training and test sets. Finally, pyplot is a module from the matplotlib library that we will use to plot the data.
# Load the iris dataset
iris = datasets.load_iris()
X = iris["data"]
y = iris["target"]
In these lines, we load the iris dataset from the datasets module and store it in a variable called iris. The iris dataset is a dictionary-like object that contains the data and the labels for the data. We store the data in a variable called X, and the labels in a variable called y. The data consists of four features for each sample (sepal length, sepal width, petal length, and petal width), and the labels are the corresponding species of iris
# Split the data into training and test sets
X_train, X_test, y_train, y_test = train_test_split(X, y, test_size=0.3)
In this line, we use the train_test_split function to split the data and labels into training and test sets. The test_size argument specifies the fraction of the data that should be used for testing. In this case, we are using 30% of the data for testing and 70% for training. The function returns four arrays: X_train and y_train contain the training data and labels, and X_test and y_test contain the test data and labels.
# Create the SVM model
model = SVC()
In this line, we create an SVM model using the SVC class. We don’t need to specify any arguments, so we can simply create an instance of the class by calling it like a function.
# Train the model on the training data
model.fit(X_train, y_train)
In this line, we use the fit method of the model object to train the model on the training data. The method takes two arguments: the data and the labels.
# Test the model on the test data
accuracy = model.score(X_test, y_test)

# Print the test accuracy
print("Test accuracy: {:.2f}".format(accuracy))
In these lines, we use the score method of the model object to evaluate the accuracy of the model on the test data. The method takes two arguments: the test data and the test labels. It returns a floating point number between 0 and 1, where 1 represents perfect accuracy. We print the accuracy to the console using string formatting.
# Plot the data
fig, ax = plt.subplots()
colors = ["r", "g", "b"]
for i in range(3):
    indices = np.where(y == i)[0]
    ax.scatter(X[indices, 0], X[indices, 1], c=colors[i], label=iris["target_names"][i])
ax.legend()
plt.show()
In these lines, we use the subplots function from matplotlib to create a figure and an axis object, and then we use the scatter method of the axis object to plot the data. We loop over the three species of iris, and for each species, we select the samples that have the corresponding label using the where function from numpy. We then plot these samples using the scatter method, with the sepal length as the x-axis and the sepal width as the y-axis. We use different colors for each species, and we add a legend to the plot using the legend method. Finally, we use the show function to display the plot.
我主要使用Ruby来执行此操作,但到目前为止我的攻击计划如下:使用gemsrdf、rdf-rdfa和rdf-microdata或mida来解析给定任何URI的数据。我认为最好映射到像schema.org这样的统一模式,例如使用这个yaml文件,它试图描述数据词汇表和opengraph到schema.org之间的转换:#SchemaXtoschema.orgconversion#data-vocabularyDV:name:namestreet-address:streetAddressregion:addressRegionlocality:addressLocalityphoto:i
有时我需要处理键/值数据。我不喜欢使用数组,因为它们在大小上没有限制(很容易不小心添加超过2个项目,而且您最终需要稍后验证大小)。此外,0和1的索引变成了魔数(MagicNumber),并且在传达含义方面做得很差(“当我说0时,我的意思是head...”)。散列也不合适,因为可能会不小心添加额外的条目。我写了下面的类来解决这个问题:classPairattr_accessor:head,:taildefinitialize(h,t)@head,@tail=h,tendend它工作得很好并且解决了问题,但我很想知道:Ruby标准库是否已经带有这样一个类? 最佳
我正在尝试使用Curbgem执行以下POST以解析云curl-XPOST\-H"X-Parse-Application-Id:PARSE_APP_ID"\-H"X-Parse-REST-API-Key:PARSE_API_KEY"\-H"Content-Type:image/jpeg"\--data-binary'@myPicture.jpg'\https://api.parse.com/1/files/pic.jpg用这个:curl=Curl::Easy.new("https://api.parse.com/1/files/lion.jpg")curl.multipart_form_
无论您是想搭建桌面端、WEB端或者移动端APP应用,HOOPSPlatform组件都可以为您提供弹性的3D集成架构,同时,由工业领域3D技术专家组成的HOOPS技术团队也能为您提供技术支持服务。如果您的客户期望有一种在多个平台(桌面/WEB/APP,而且某些客户端是“瘦”客户端)快速、方便地将数据接入到3D应用系统的解决方案,并且当访问数据时,在各个平台上的性能和用户体验保持一致,HOOPSPlatform将帮助您完成。利用HOOPSPlatform,您可以开发在任何环境下的3D基础应用架构。HOOPSPlatform可以帮您打造3D创新型产品,HOOPSSDK包含的技术有:快速且准确的CAD
本教程将在Unity3D中混合Optitrack与数据手套的数据流,在人体运动的基础上,添加双手手指部分的运动。双手手背的角度仍由Optitrack提供,数据手套提供双手手指的角度。 01 客户端软件分别安装MotiveBody与MotionVenus并校准人体与数据手套。MotiveBodyMotionVenus数据手套使用、校准流程参照:https://gitee.com/foheart_1/foheart-h1-data-summary.git02 数据转发打开MotiveBody软件的Streaming,开始向Unity3D广播数据;MotionVenus中设置->选项选择Unit
文章目录一、概述简介原理模块二、配置Mysql使用版本环境要求1.操作系统2.mysql要求三、配置canal-server离线下载在线下载上传解压修改配置单机配置集群配置分库分表配置1.修改全局配置2.实例配置垂直分库水平分库3.修改group-instance.xml4.启动监听四、配置canal-adapter1修改启动配置2配置映射文件3启动ES数据同步查询所有订阅同步数据同步开关启动4.验证五、配置canal-admin一、概述简介canal是Alibaba旗下的一款开源项目,Java开发。基于数据库增量日志解析,提供增量数据订阅&消费。Git地址:https://github.co
我正在尝试在Rails上安装ruby,到目前为止一切都已安装,但是当我尝试使用rakedb:create创建数据库时,我收到一个奇怪的错误:dyld:lazysymbolbindingfailed:Symbolnotfound:_mysql_get_client_infoReferencedfrom:/Library/Ruby/Gems/1.8/gems/mysql2-0.3.11/lib/mysql2/mysql2.bundleExpectedin:flatnamespacedyld:Symbolnotfound:_mysql_get_client_infoReferencedf
文章目录1.开发板选择*用到的资源2.串口通信(个人理解)3.代码分析(注释比较详细)1.主函数2.串口1配置3.串口2配置以及中断函数4.注意问题5.源码链接1.开发板选择我用的是STM32F103RCT6的板子,不过代码大概在F103系列的板子上都可以运行,我试过在野火103的霸道板上也可以,主要看一下串口对应的引脚一不一样就行了,不一样的就更改一下。*用到的资源keil5软件这里用到了两个串口资源,采集数据一个,串口通信一个,板子对应引脚如下:串口1,TX:PA9,RX:PA10串口2,TX:PA2,RX:PA32.串口通信(个人理解)我就从串口采集传感器数据这个过程说一下我自己的理解,
SPI接收数据左移一位问题目录SPI接收数据左移一位问题一、问题描述二、问题分析三、探究原理四、经验总结最近在工作在学习调试SPI的过程中遇到一个问题——接收数据整体向左移了一位(1bit)。SPI数据收发是数据交换,因此接收数据时从第二个字节开始才是有效数据,也就是数据整体向右移一个字节(1byte)。请教前辈之后也没有得到解决,通过在网上查阅前人经验终于解决问题,所以写一个避坑经验总结。实际背景:MCU与一款芯片使用spi通信,MCU作为主机,芯片作为从机。这款芯片采用的是它规定的六线SPI,多了两根线:RDY和INT,这样从机就可以主动请求主机给主机发送数据了。一、问题描述根据从机芯片手
前言一般来说,前端根据后台返回code码展示对应内容只需要在前台判断code值展示对应的内容即可,但要是匹配的code码比较多或者多个页面用到时,为了便于后期维护,后台就会使用字典表让前端匹配,下面我将在微信小程序中通过wxs的方法实现这个操作。为什么要使用wxs?{{method(a,b)}}可以看到,上述代码是一个调用方法传值的操作,在vue中很常见,多用于数据之间的转换,但由于微信小程序诸多限制的原因,你并不能优雅的这样操作,可能有人会说,为什么不用if判断实现呢?但是if判断的局限性在于如果存在数据量过大时,大量重复性操作和if判断会让你的代码显得异常冗余。wxswxs相当于是一个独立